PR-URL: https://github.com/hasura/graphql-engine-mono/pull/10764 Co-authored-by: github-actions[bot] <41898282+github-actions[bot]@users.noreply.github.com> GitOrigin-RevId: 3dfb3478cefc8ffa9067295293203e06b3eac90c |
||
|---|---|---|
| .. | ||
| alertmanager | ||
| assets/images | ||
| blackboxexporter | ||
| examples/hasura | ||
| grafana | ||
| otel-collector | ||
| prometheus | ||
| .gitignore | ||
| docker-compose.yml | ||
| dotenv | ||
| README.md | ||
Hasura Enterprise Observability Demo
An all-in-one observability demo for Hasura GraphQL Engine Enterprise Edition with Prometheus, Jaeger, Alert-manager, Node Exporter, Loki Logs, OpenTelemetry and Grafana dashboards.
Get Started
- Copy
dotenvto.envand configure secrets and EE License Key. - Try
docker-composelocally withdocker-compose up -d, or run the Docker Swarm stack with scripts that are in theutilfolder.
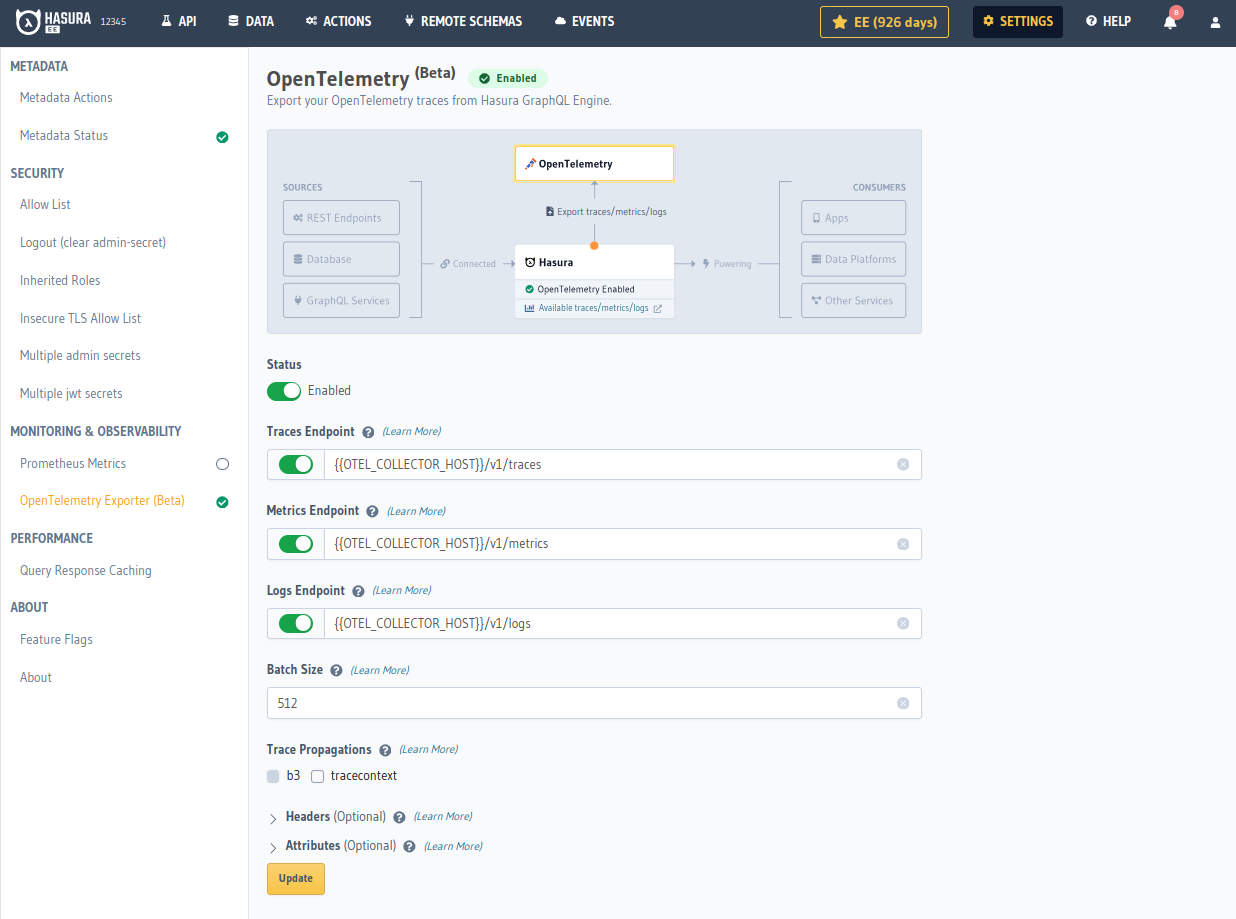
The default configuration enables the Native Prometheus exporter. If you want to push metrics to 3rd-party services that support OpenTelemetry, first disable the metrics API and configure the OpenTelemetry metrics endpoint to the otel-collector service. Browse the console -> Settings -> OpenTelemetry Exporter and configure the metrics endpoint.
HGE_ENABLED_APIS=metadata,graphql,config
Components
Here's a list of all the services that are created:
| Service | Port | Description | Notes |
|---|---|---|---|
| HGE | :8080 | Hasura GraphQL Engine | |
| Postgres | :5432 | Postgres Database Container | |
| Prometheus | :9090 | Data Aggregator | |
| Alert Manager | :9093 | Adds Alerting for Prometheus Checks | |
| Grafana | :3000 | UI To Show Prometheus Data | Username: admin, Password: HGEMonitoring! |
| Node Exporter | :9100 | Data Collector for Host Stats | |
| Blackbox Exporter | :9115 | Data Collector for Ping & Uptime | |
| Redis | :6379 | Latest Redis Cache Container | |
| Jaeger | :4318 | Jaeger OTLP HTTP | |
| Jaeger | :4317 | Jaeger OTLP gRPC | |
| Jaeger | :4002 | Jaeger Web UI | |
| Loki | :3100 | Loki Logging Collector | |
| Promtail | Pushes logs to Loki |
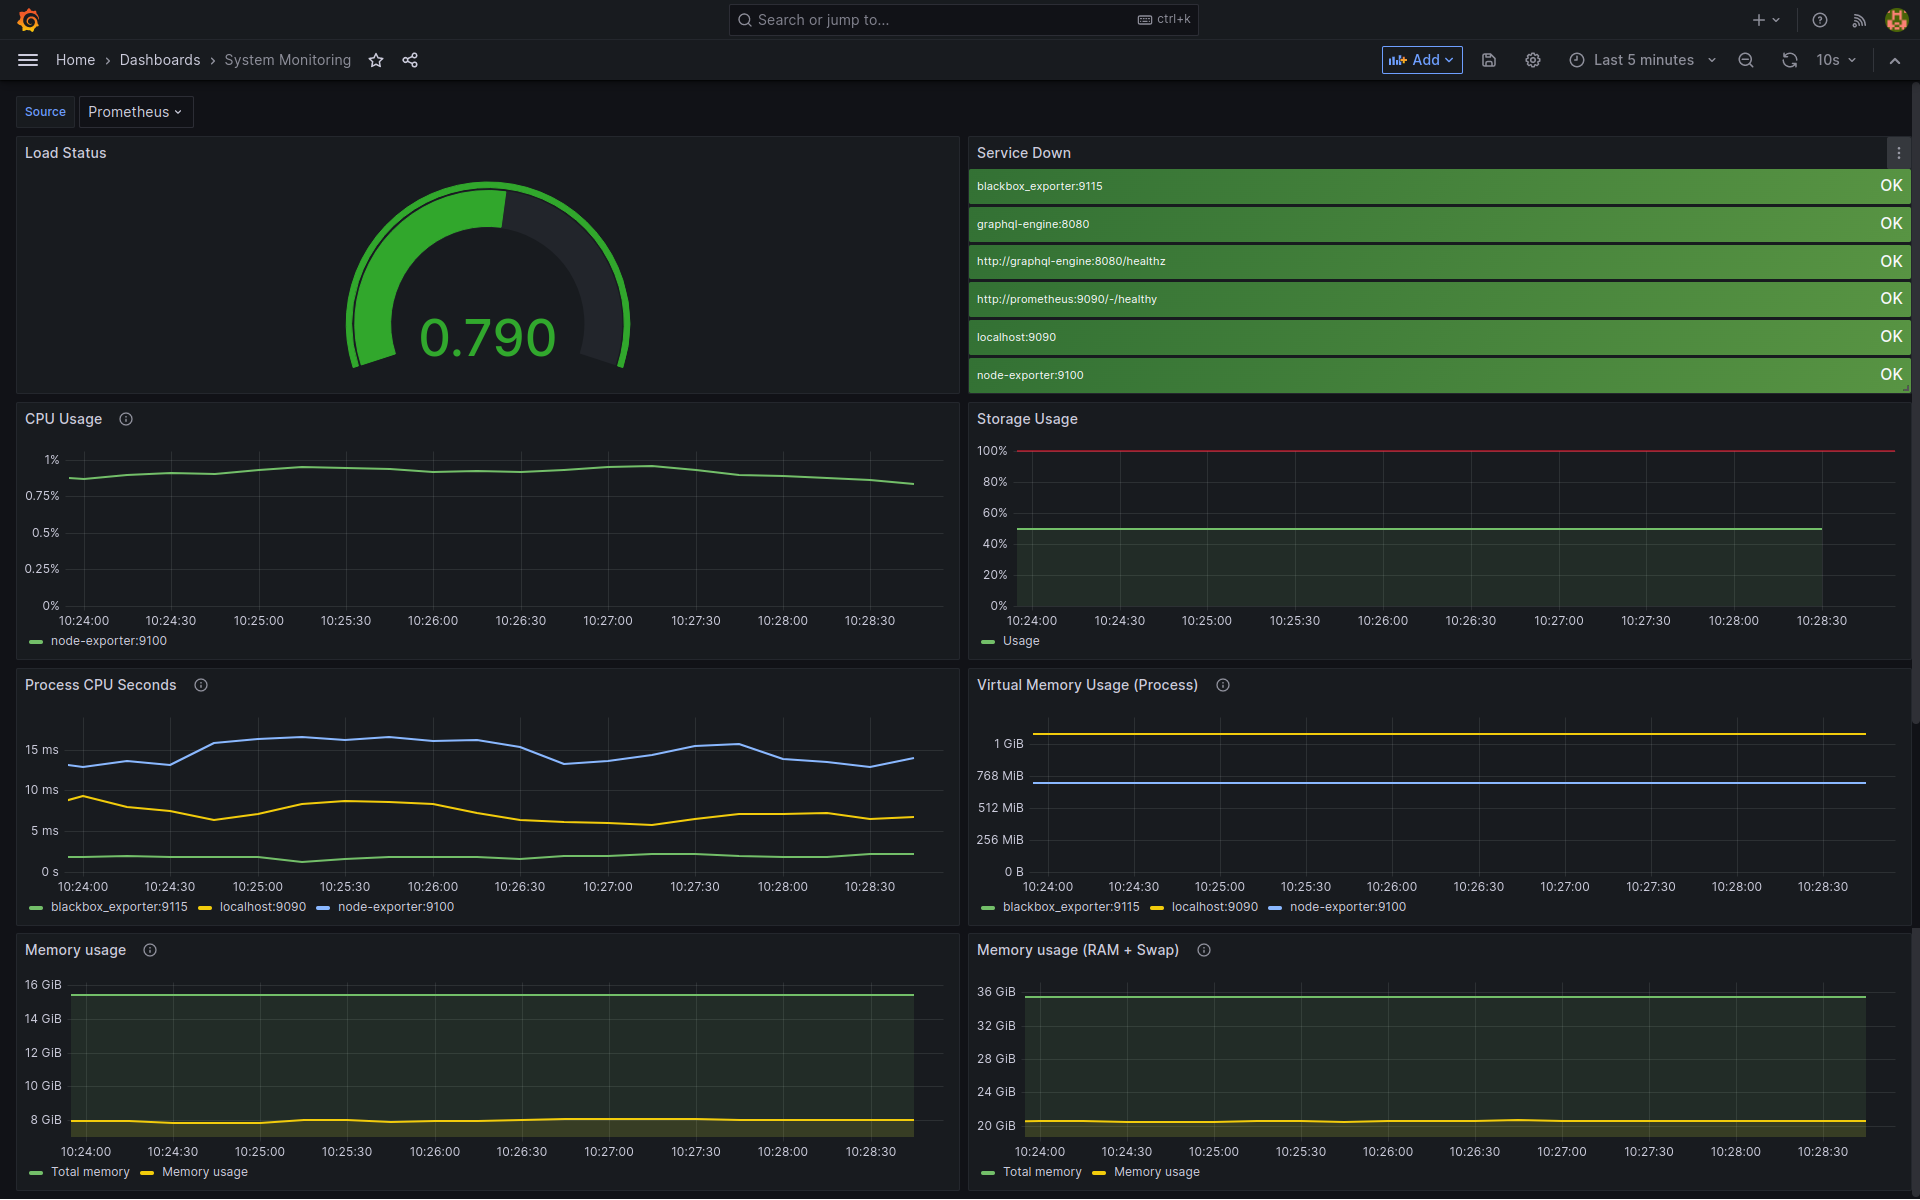
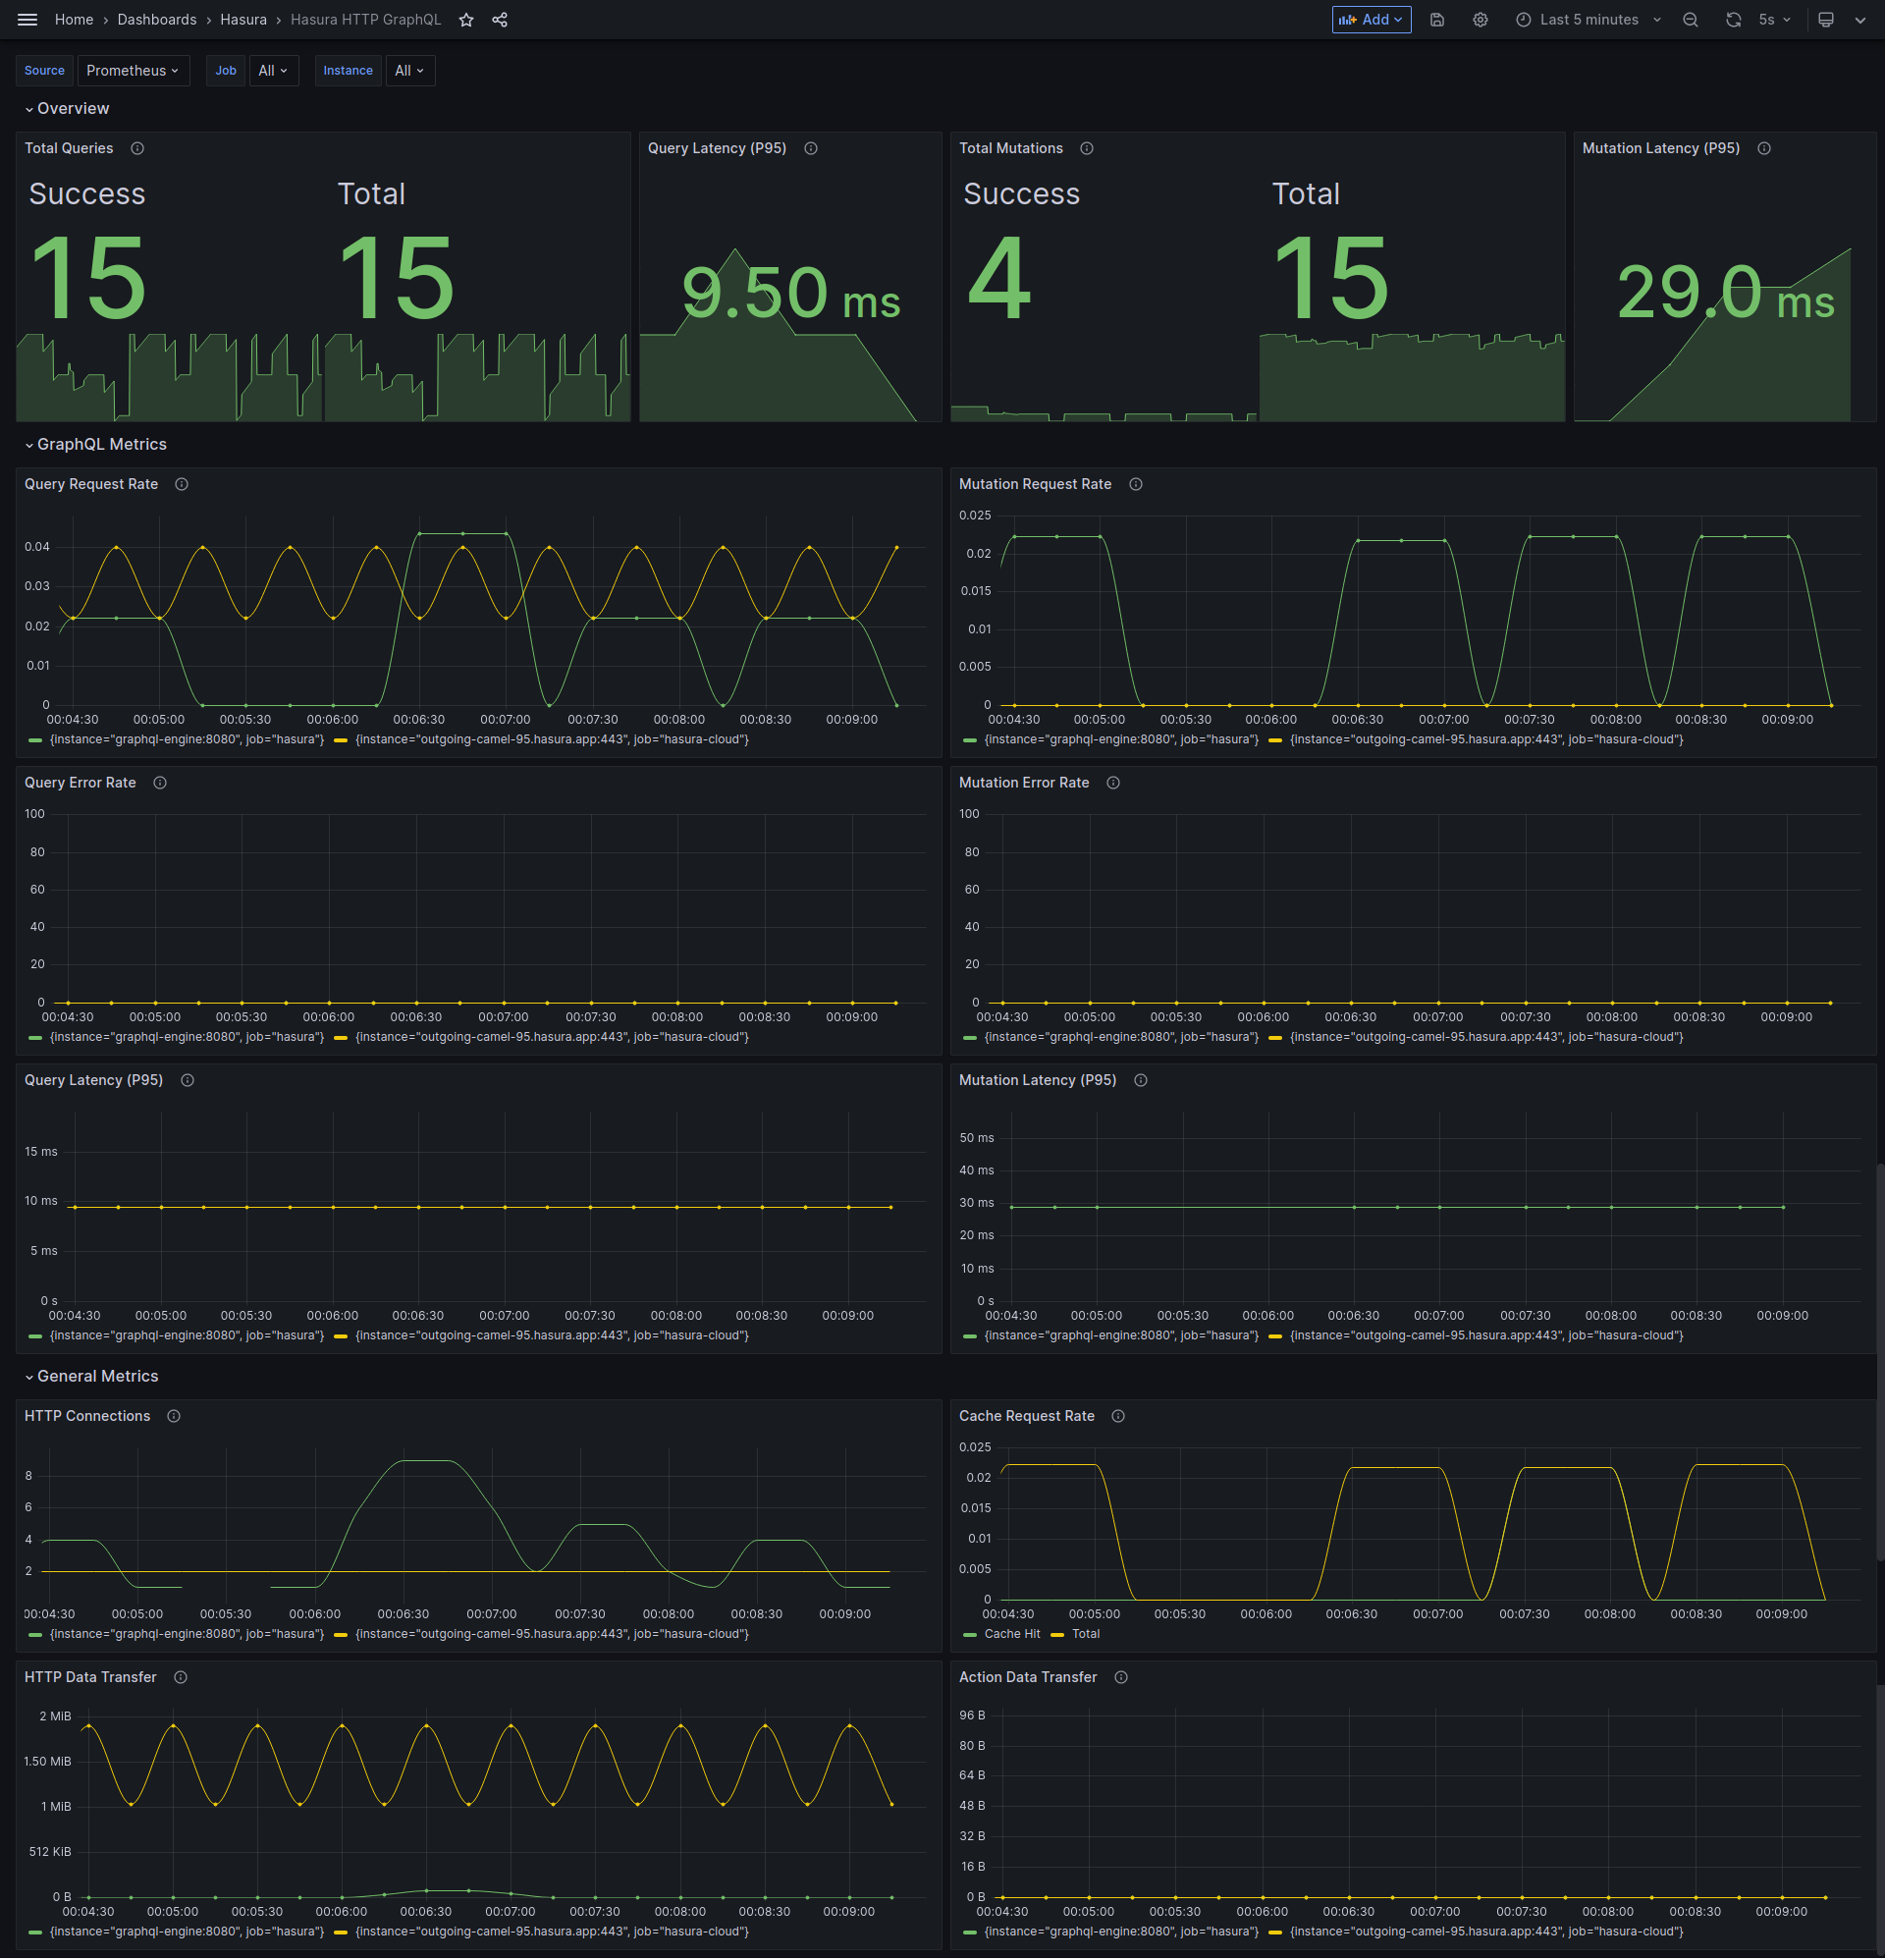
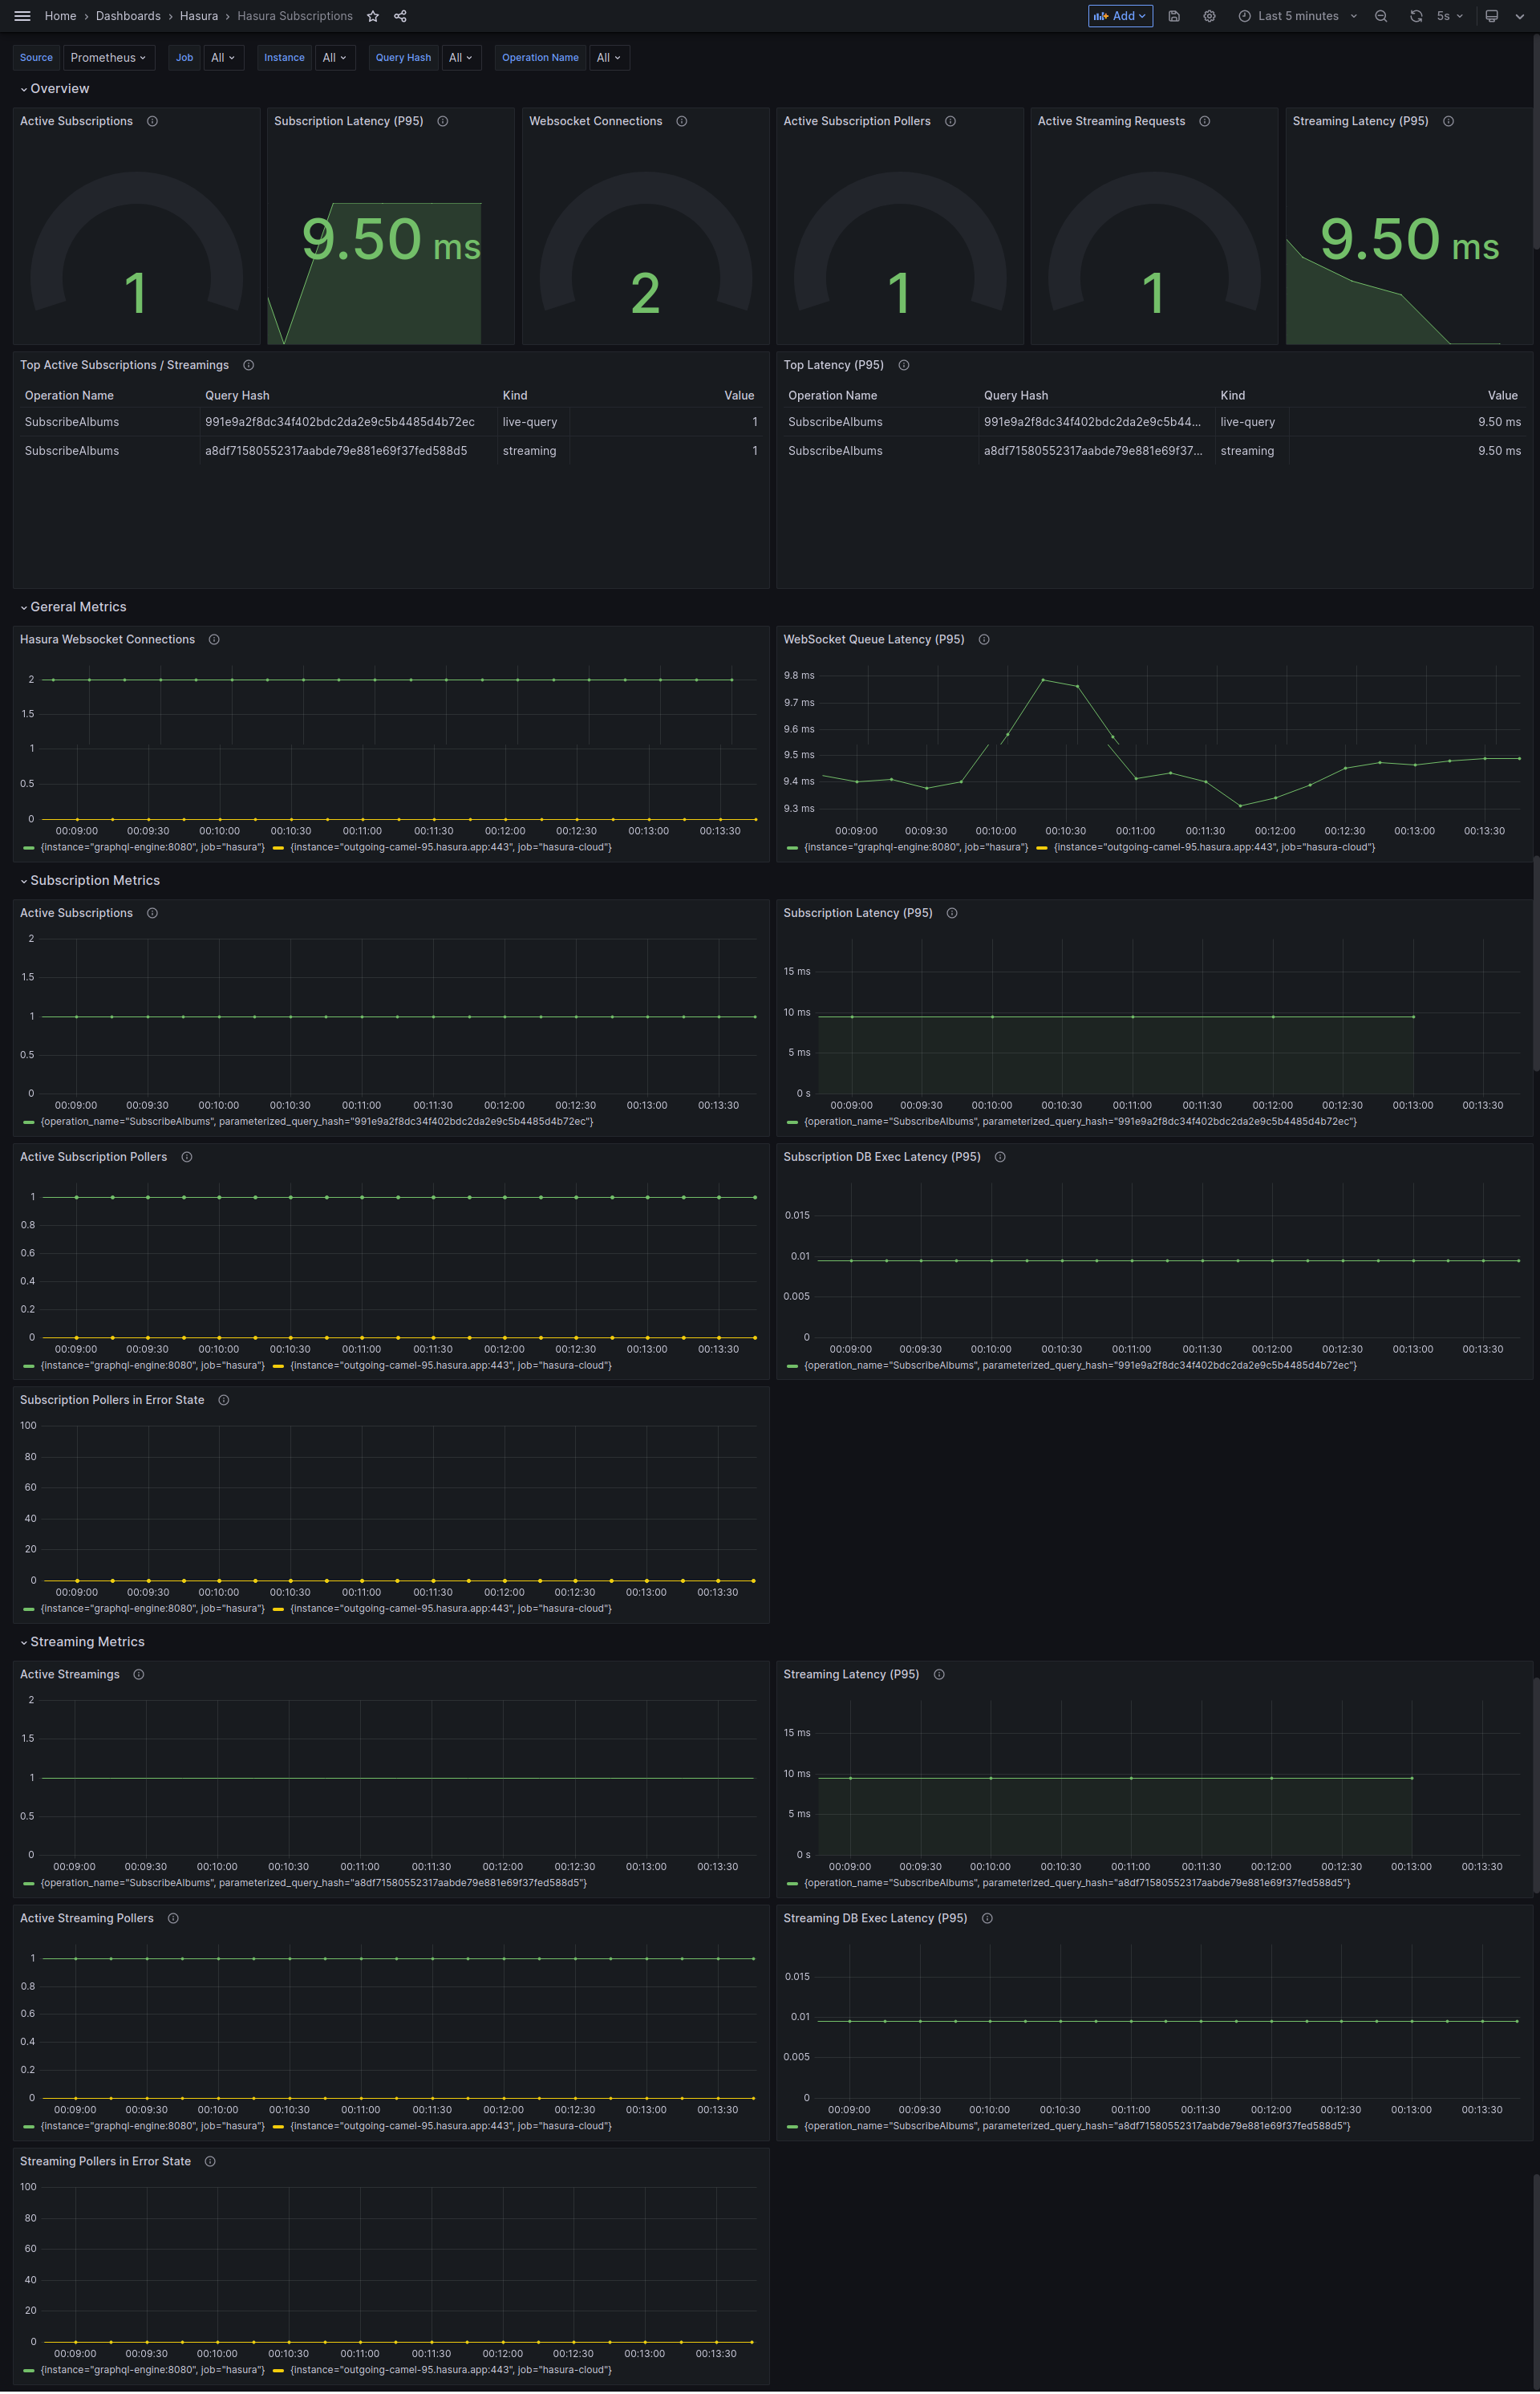
Grafana Dashboards
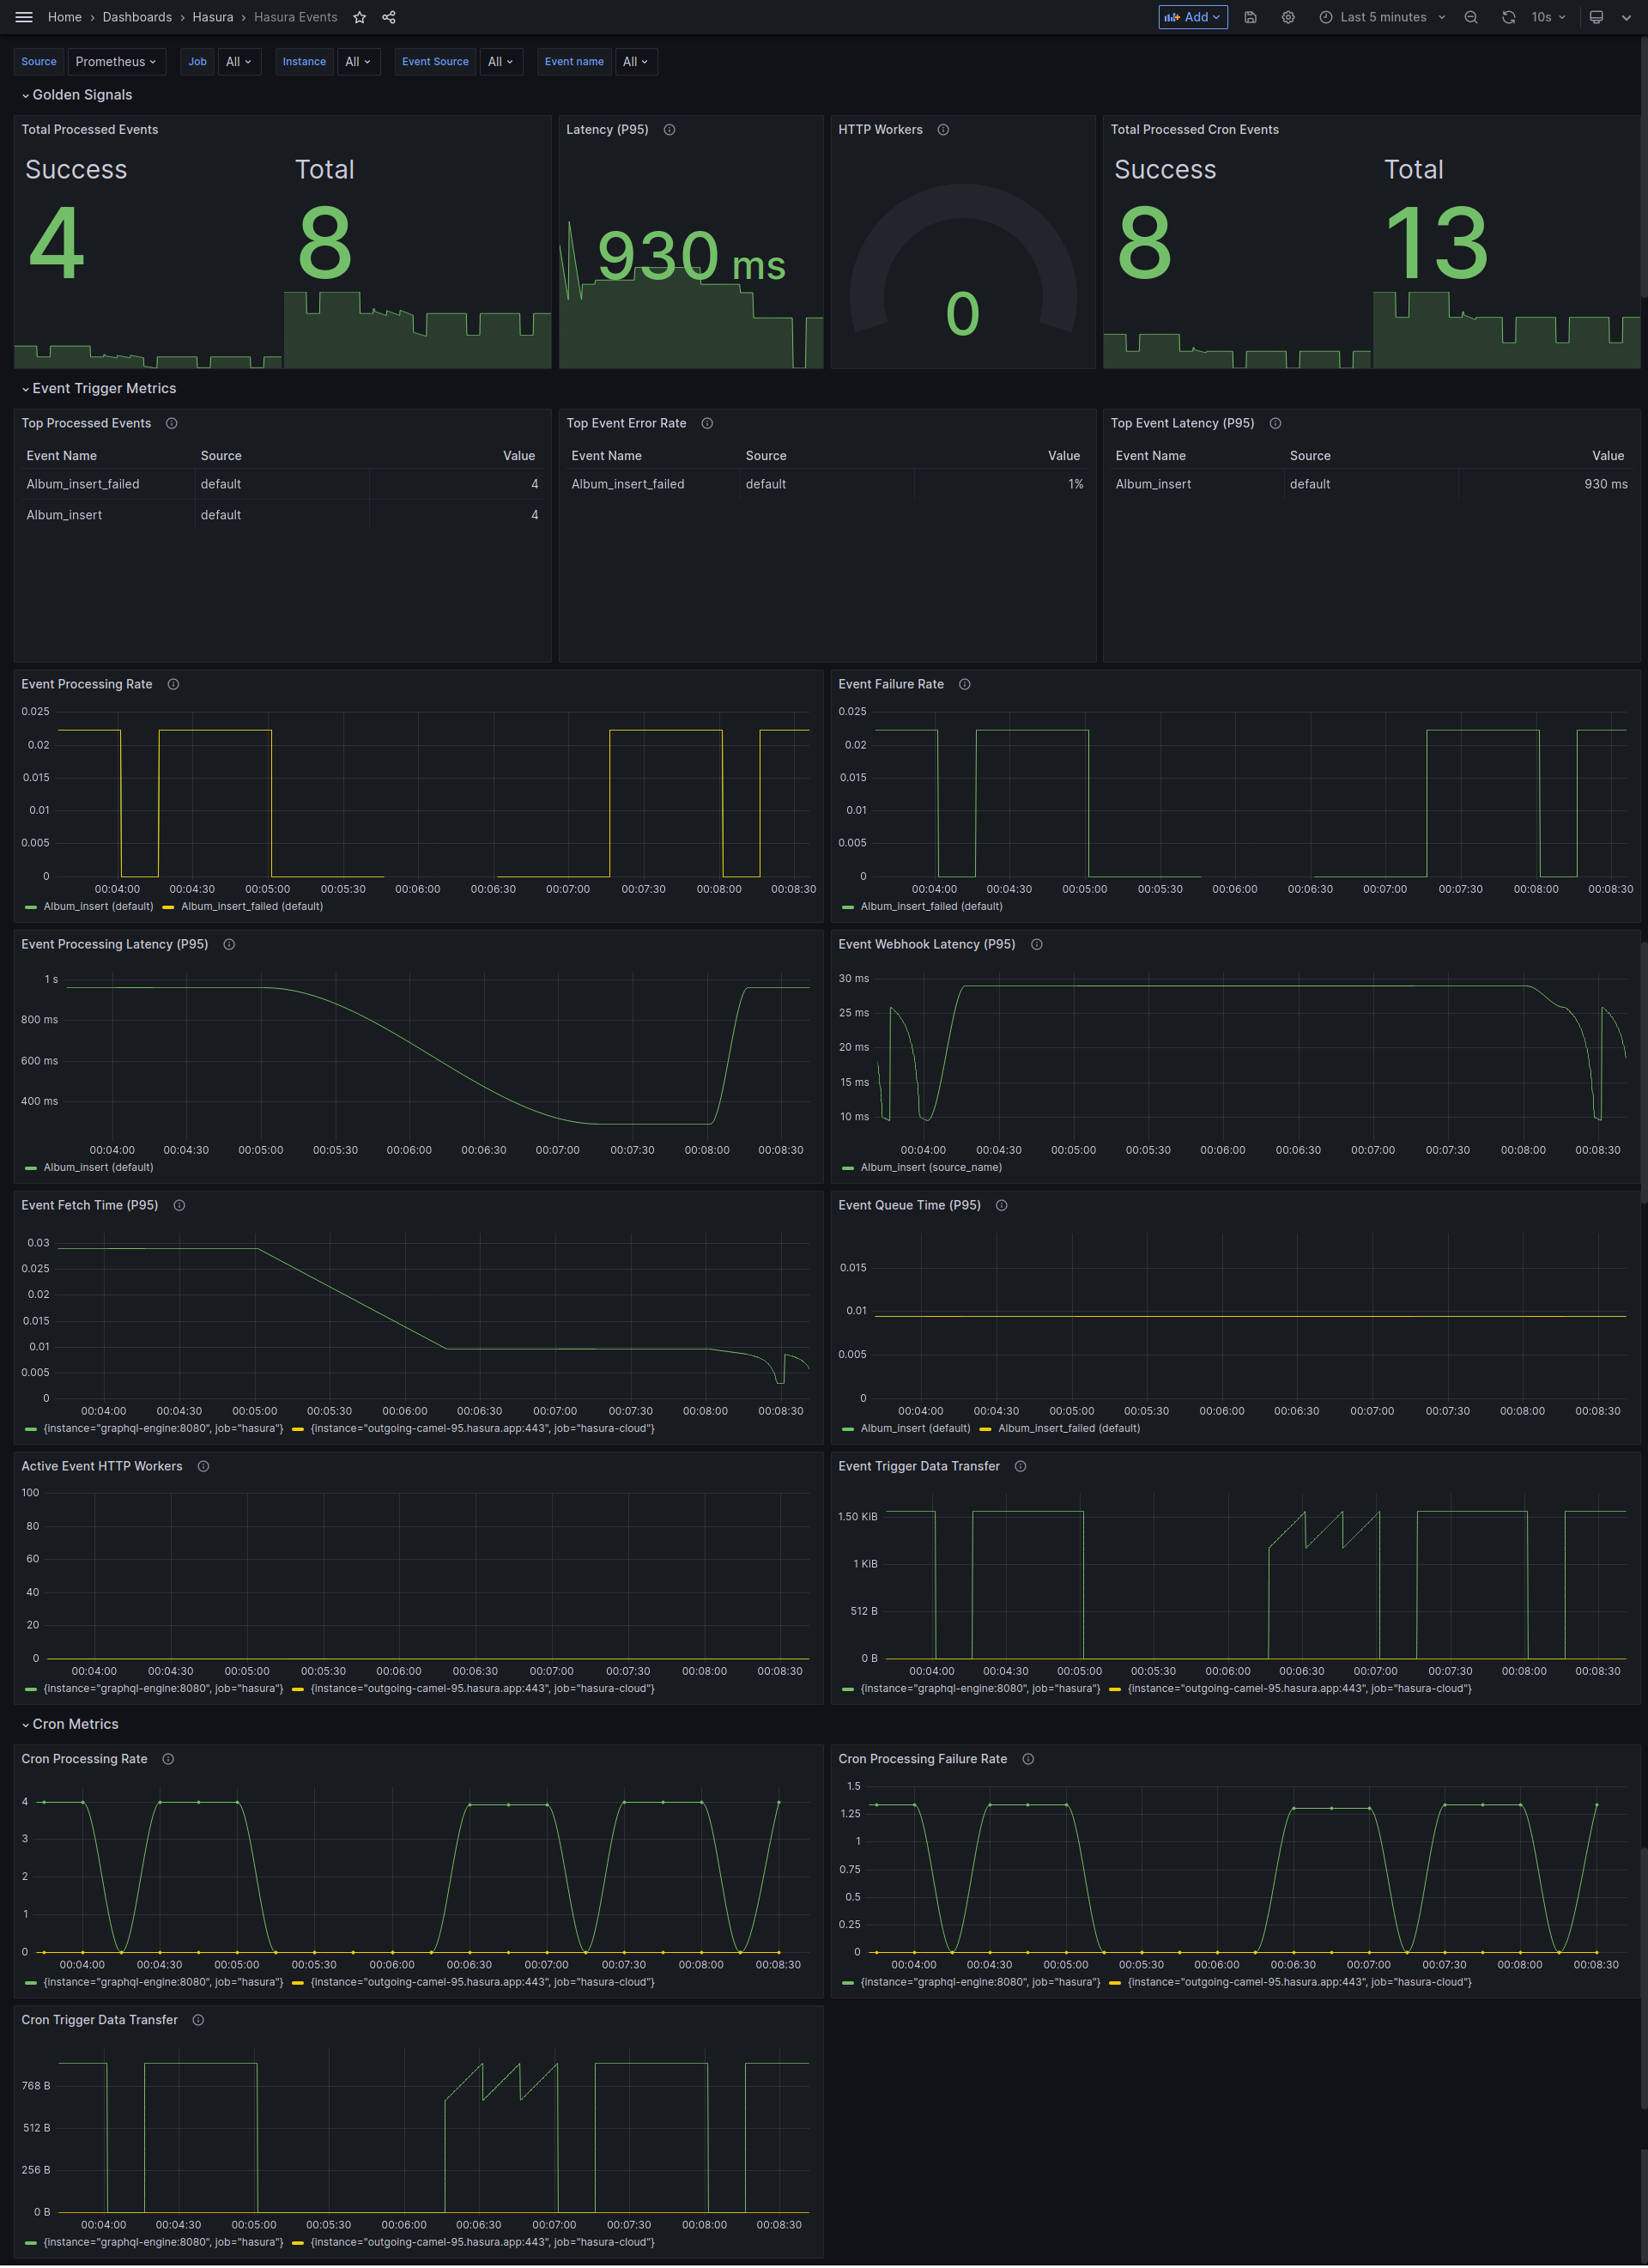
Dashboard templates are collected in the dashboards/hasura folder. You can import those files to your config folders where the Grafana service is configured, or import them directly on the Grafana web UI.
Example
The default GraphQL Engine service uses migration and metadata configuration in the examples/hasura folder to invoke mock requests for metrics demonstration.
FAQs
How can I enable metrics in the the Source Health panel
Currently, only Postgres supports source health check metrics.
To enable Source Health check metrics you need to configure the health check metadata for each data source.
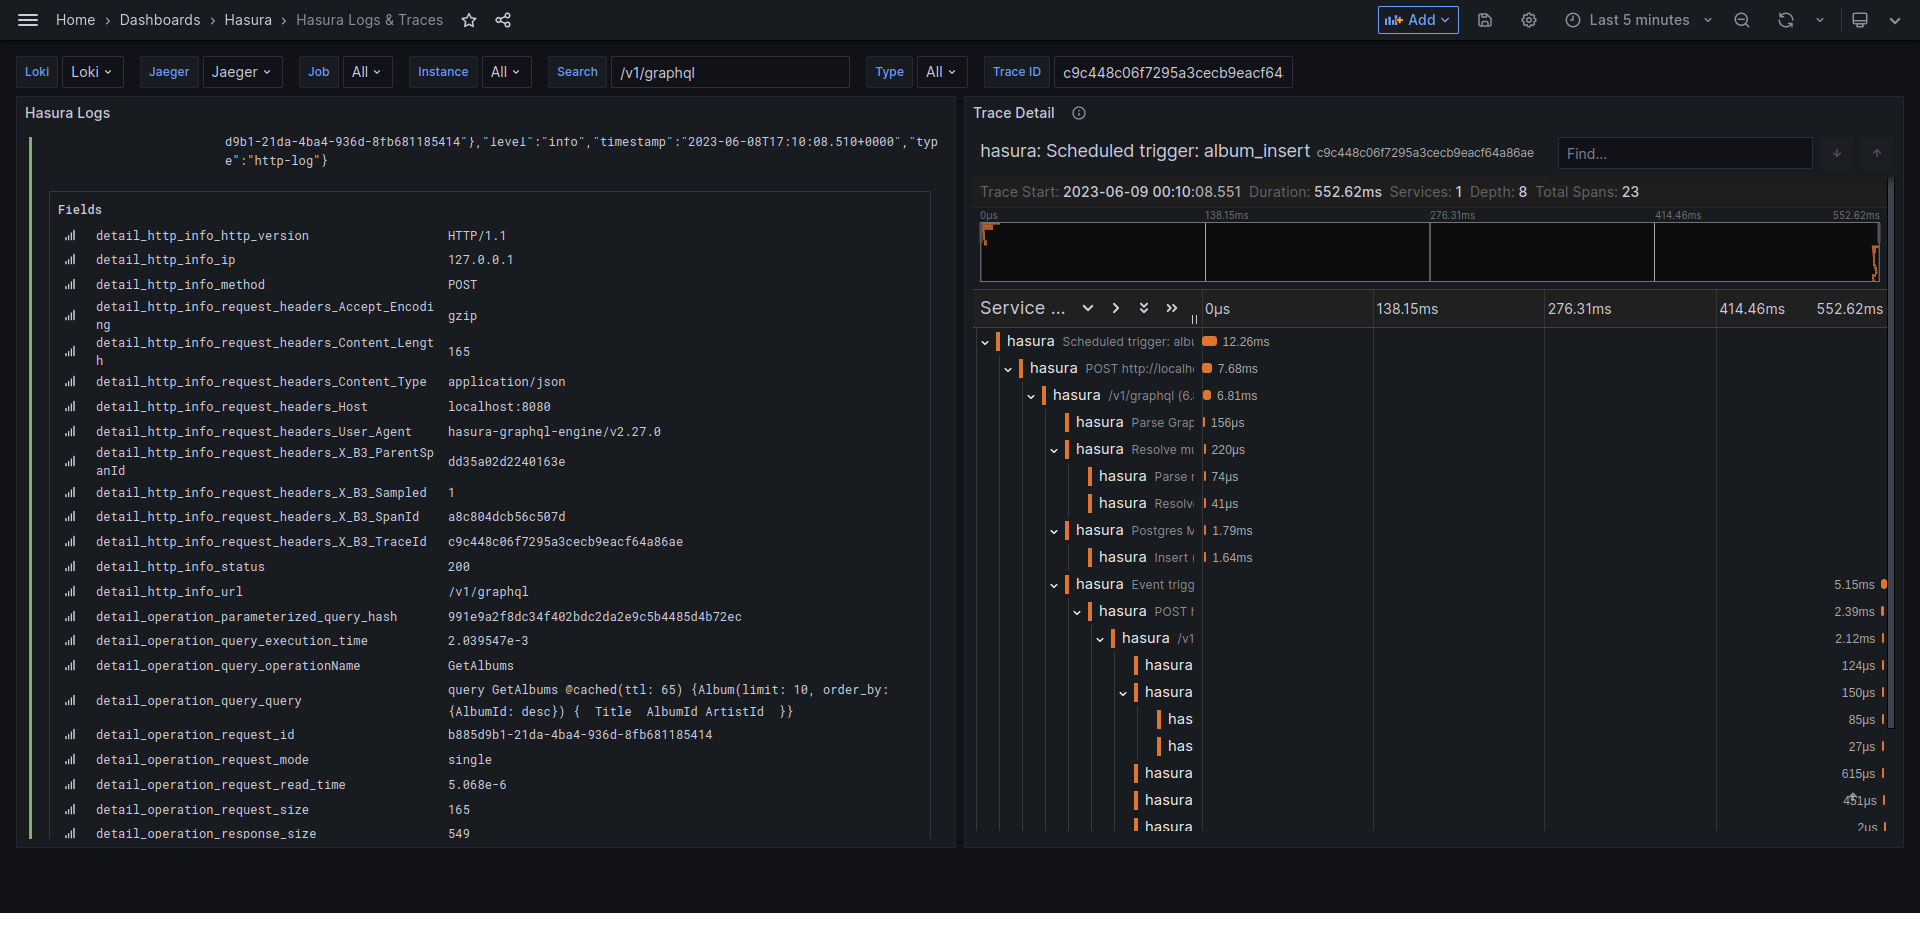
How can I find the Trace ID of GraphQL Requests
You can find the Trace ID in the X-B3-TraceId request header.
