| .. | ||
| charts | ||
| data.py | ||
| Makefile | ||
| model.py | ||
| params.json | ||
| query.sql | ||
| README.md | ||
| report.py | ||
| report.txt | ||
| requirements.txt | ||
Background
We want to understand which of our users are monetizable. We know the users who have converted so far are monetizable. We believe that if we train a model on users who have converted so far, then the model probabilities will be correlated with monetizability, more generally.
We look at users who have sent a kite status since 2020-01-01. We say a user has converted if they have sent a kite status with a pro yearly or pro monthly plan.
Models
We use logistic regression with the following features:
- OS
- Git found
- CPU threads
- Editors installed
- Paid version of IntelliJ installed
- Country (four groups: USA, China, India, other)
Validation
We plot precision-recall curves and compute the average precision score for each set of features. We also plot ROC curves and compute the area under the ROC curves. Predictions are made for every user in the dataset, using K-fold cross validation.
Precision-recall

ROC

Distribution of probabilities, by label
We look at the PDF and CDF of the distribution of model probabilities, for converted users and non-converted users separately.

CDF

Fitted model parameters
Warning: It can be hard to interpret logistic regression or any linear models when the features are correlated. For example, suppose you model the value of sets of coins using two features, "number of coins" and "number of pennies, nickels, and dimes". You might get something like:
total value ~ 25 * number of coins - 19.67 * number of pennies, nickels, and dimes
Even though the coefficient is negative, you wouldn't want to conclude that pennies, nickels, and dimes have negative value. If you switched to two independent features, "number of quarters" and "number of pennies, nickels, and dimes", you might get:
total value ~ 25 * number of quarters + 5.33 * number of pennies, nickels, and dimes
| parameter | value |
|---|---|
| intercept | -11.55521353197379 |
| windows | 0.9065071371157214 |
| darwin | 1.4048734240895897 |
| linux | 1.2317880140394553 |
| git_found | 1.110573018166445 |
| cpu_threads | 0.01880191704417484 |
| intellij_paid | 1.8858658411078215 |
| atom_installed | 0.1444944853137855 |
| intellij_installed | -0.033165752622047615 |
| pycharm_installed | 0.6120519347099082 |
| sublime3_installed | 0.595042952280331 |
| vim_installed | 0.7398803384306187 |
| vscode_installed | 0.5952001332567838 |
| USA | 0.953796489511271 |
| China | -1.3216059568715008 |
| India | -0.7939960992731963 |
Some more charts
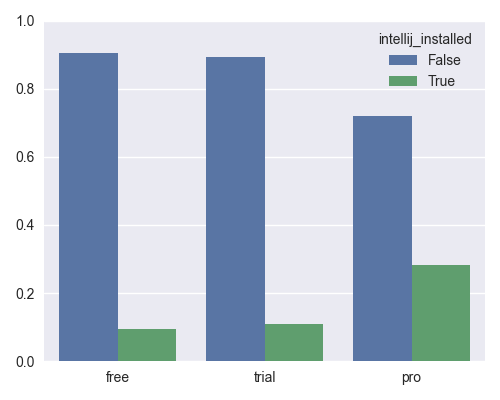
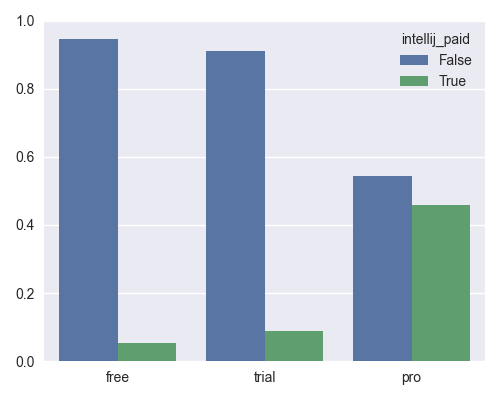
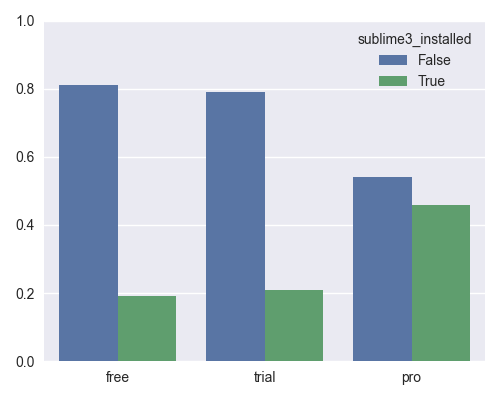
We measure some stats for different groups:
- free: users who activated, but have not trialed or converted.
- trial: users who have trialed, but not converted.
- pro: users who have converted.
Country, by group

OS, by group
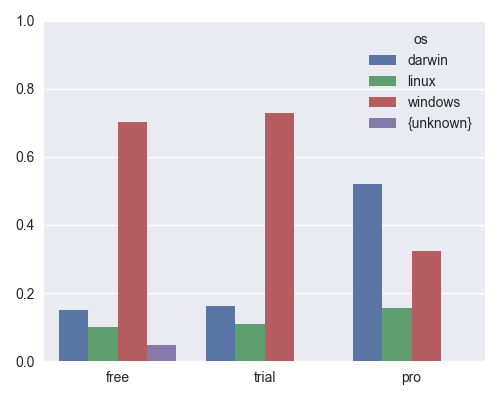
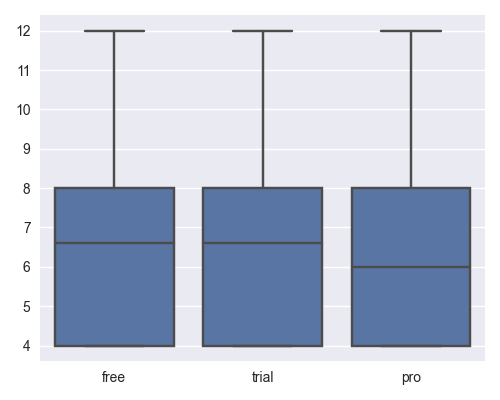
CPU threads, by group
The boxes shows the quartiles and median. The whiskers show the 10th and 90th percentiles.
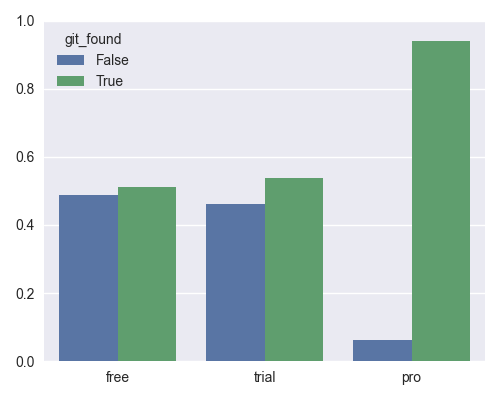
Git found, by group
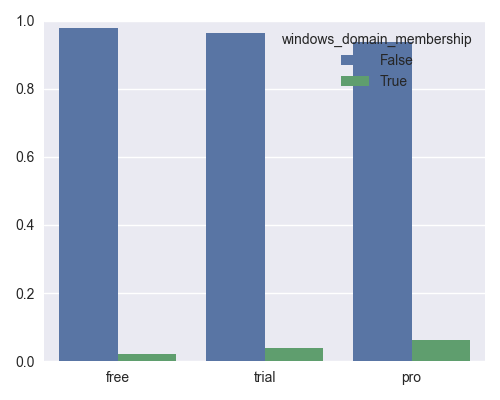
Windows domain membership, by group
Activation month, by group
Activation month is the first month that a user sent a kite status, going back to 2020-01-01. Users who activated before January 2020 are incorrectly labelled.

Editors
Atom installed, by group

ItelliJ installed, by group
IntelliJ paid version installed, by group
PyCharm installed, by group

Sublime3 installed, by group
Vim installed, by group

VSCode installed, by group
