mirror of
https://github.com/codedownio/time-ghc-modules.git
synced 2024-07-04 16:36:25 +03:00
Analyze GHC .dump-timings files
| .github/workflows | ||
| dist | ||
| scripts | ||
| src | ||
| .gitignore | ||
| CHANGELOG.md | ||
| default.nix | ||
| hledger.gif | ||
| hledger.png | ||
| hledger.svg | ||
| LICENSE | ||
| package-lock.json | ||
| package.json | ||
| pinned-nixpkgs.nix | ||
| README.md | ||
| time-ghc-modules | ||
| time-ghc-modules-nix | ||
| tsconfig.json | ||
time-ghc-modules
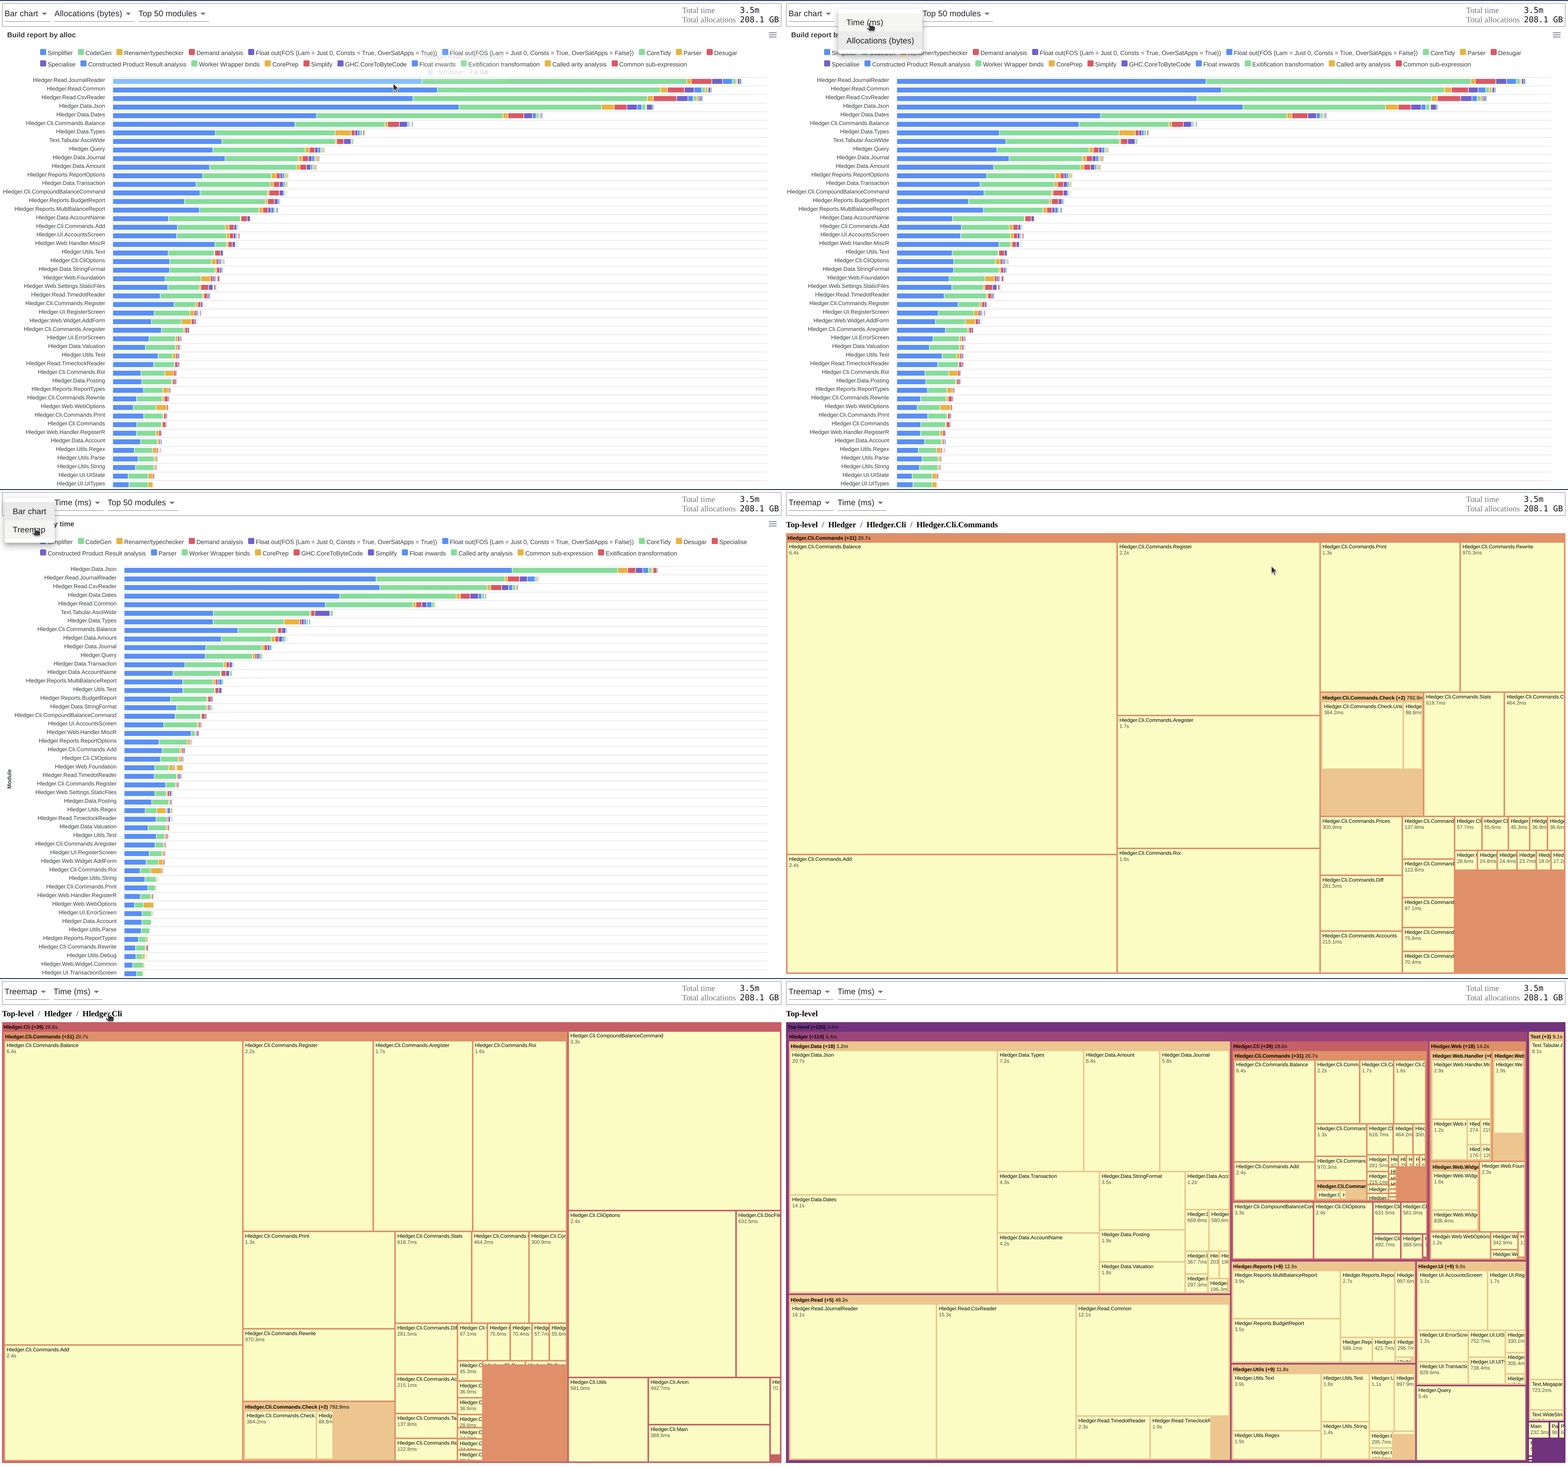
Figure out why your builds are slow. This tool analyzes how long it takes GHC to compile your Haskell modules, broken down by phase. It can draw both bar charts and treemaps, of time or space usage.
Quick start
cd <my-project>

stack clean
stack build --ghc-options "-ddump-to-file -ddump-timings"
# ----- OR -----
cabal clean
cabal build all --ghc-options "-ddump-to-file -ddump-timings"
If you have Nix, you can simply run time-ghc-modules from Nixpkgs!
nix run nixpkgs#time-ghc-modules
Or, clone the repo first:
git clone git@github.com:codedownio/time-ghc-modules.git /path/to/time-ghc-modules

# If you have Nix, you can use the fully reproducible version
/path/to/time-ghc-modules/time-ghc-modules-nix

# Otherwise, your system needs to have SQLite >= 3.33.0, Python 3, and sed
/path/to/time-ghc-modules/time-ghc-modules
The script will search for all your *.dump-timings files and analyze them. It will finish by printing out the path to an HTML file:
...
--> Wrote report at file:///tmp/tmp.pvnp4FYmLa/report.html
Example: hledger
You can generate the time report below for hledger by running the following commands (assuming you have Nix).
set -e
cd $(mktemp -d)
git clone git@github.com:simonmichael/hledger.git
git clone git@github.com:codedownio/time-ghc-modules.git
cd hledger
stack build --ghc-options "-ddump-to-file -ddump-timings"
../time-ghc-modules/time-ghc-modules-nix
Tips
- The script will output its log messages to
stderrand print the final report path tostdout(assuming it didn't exit with a failure). This makes it easy to use the output in scripts. For example:
# Build the report and open it in your browser
> firefox $(/path/to/time-ghc-modules/time-ghc-modules)
# Build the report in CI and stash it somewhere
> cp $(/path/to/time-ghc-modules/time-ghc-modules) $MY_CI_ARTIFACTS_DIR/
- You can also look at the timing of individual components, but doing e.g.
stack build some-component:lib. But, make sure to clean up any old.dump-timingsfiles from previous runs:
find . -name "*.dump-timings" | xargs rm
- GHC's
-dumpdiroption can be used to consolidate the.dump-timingsfiles, so they aren't left all over your source tree. For example:
stack build --ghc-options "-ddump-to-file -ddump-timings -dumpdir .ghcdump"
Compatibility
The flag -ddump-timings is available for GHC >= 8.4.1.
