mirror of
https://github.com/codedownio/time-ghc-modules.git
synced 2024-07-14 16:50:32 +03:00
Analyze GHC .dump-timings files
| .github/workflows | ||
| dist | ||
| scripts | ||
| src | ||
| .gitignore | ||
| CHANGELOG.md | ||
| default.nix | ||
| hledger.png | ||
| hledger.svg | ||
| LICENSE | ||
| package-lock.json | ||
| package.json | ||
| pinned-nixpkgs.nix | ||
| README.md | ||
| time-ghc-modules | ||
| time-ghc-modules-nix | ||
| tsconfig.json | ||
time-ghc-modules
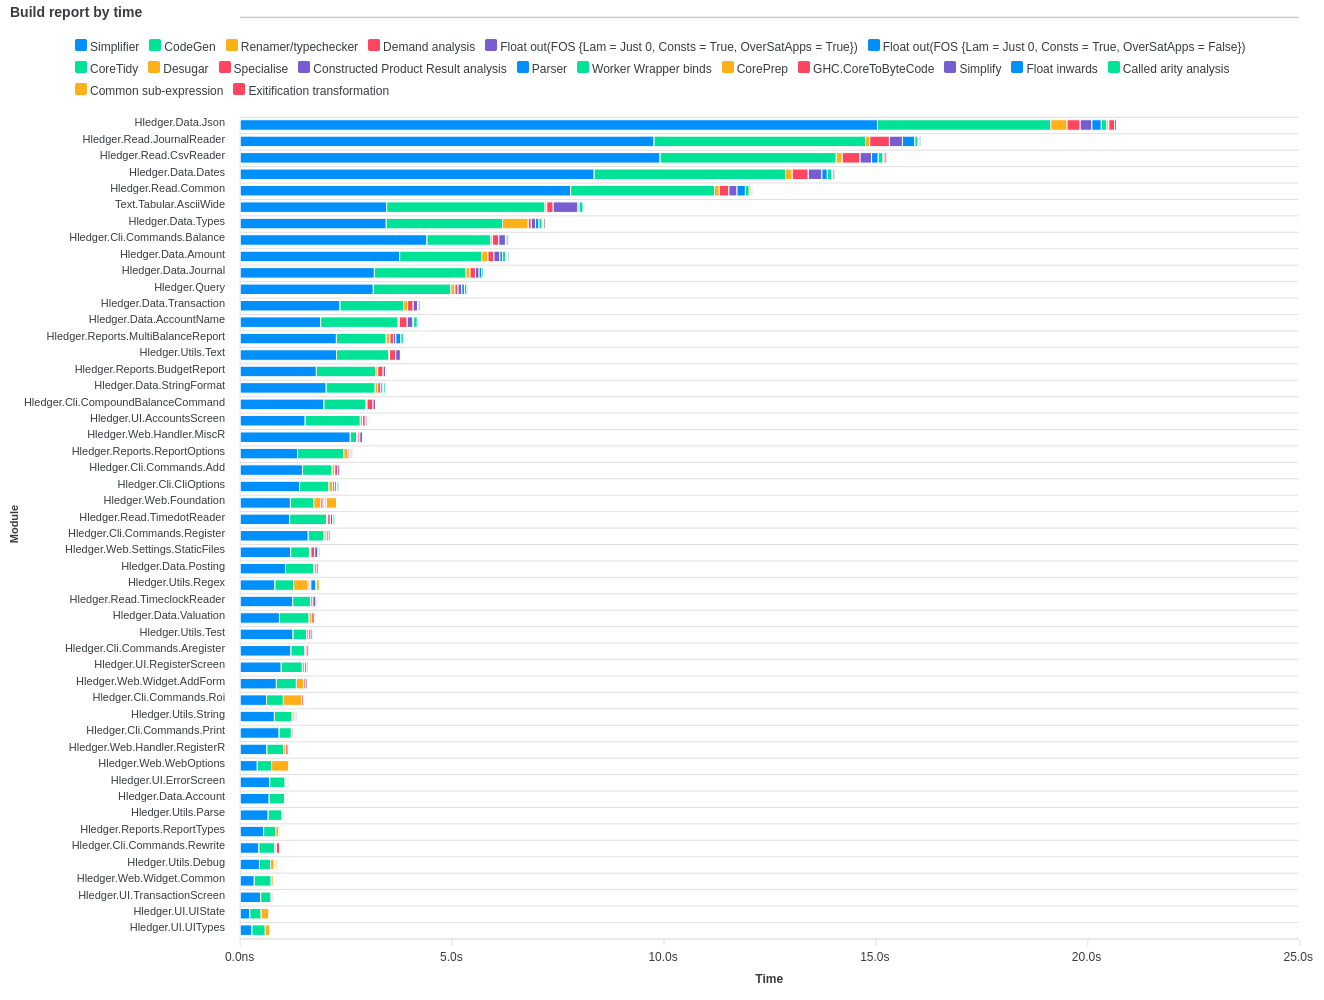
Figure out why your builds are slow. This tool analyzes how long it takes GHC to compile your Haskell modules, broken down by phase.
Quick start
cd <my-project>

stack clean
stack build --ghc-options "-ddump-to-file -ddump-timings"
# ----- OR -----
cabal clean
cabal build all --ghc-options "-ddump-to-file -ddump-timings"
If you have Nix, you can simply run time-ghc-modules from Nixpkgs!
nix run nixpkgs#time-ghc-modules
Or, clone the repo first:
git clone git@github.com:codedownio/time-ghc-modules.git /path/to/time-ghc-modules

# If you have Nix, you can use the fully reproducible version
/path/to/time-ghc-modules/time-ghc-modules-nix

# Otherwise, your system needs to have SQLite >= 3.33.0, Python 3, and sed
/path/to/time-ghc-modules/time-ghc-modules
The script will search for all your *.dump-timings files and analyze them. It will finish by printing out the path to an HTML file:
...
--> Wrote report at file:///tmp/tmp.pvnp4FYmLa/report.html
Example: hledger
You can generate the time report below for hledger by running the following commands (assuming you have Nix).
set -e
cd $(mktemp -d)
git clone git@github.com:simonmichael/hledger.git
git clone git@github.com:codedownio/time-ghc-modules.git
cd hledger
stack build --ghc-options "-ddump-to-file -ddump-timings"
../time-ghc-modules/time-ghc-modules-nix
Tips
- The script will output its log messages to
stderrand print the final report path tostdout(assuming it didn't exit with a failure). This makes it easy to use the output in scripts. For example:
# Build the report and open it in your browser
> firefox $(/path/to/time-ghc-modules/time-ghc-modules)
# Build the report in CI and stash it somewhere
> cp $(/path/to/time-ghc-modules/time-ghc-modules) $MY_CI_ARTIFACTS_DIR/
- You can also look at the timing of individual components, but doing e.g.
stack build some-component:lib. But, make sure to clean up any old.dump-timingsfiles from previous runs:
find . -name "*.dump-timings" | xargs rm
- GHC's
-dumpdiroption can be used to consolidate the.dump-timingsfiles, so they aren't left all over your source tree. For example:
stack build --ghc-options "-ddump-to-file -ddump-timings -dumpdir .ghcdump"
Compatibility
The flag -ddump-timings is available for GHC >= 8.4.1.