mirror of
https://github.com/enso-org/enso.git
synced 2024-12-23 21:01:51 +03:00
49 lines
1.9 KiB
Markdown
49 lines
1.9 KiB
Markdown
|
|
# Debugging Enso and Java Code at Once
|
||
|
|
|
||
|
|
Enso libraries are written in a mixture of Enso code and Java libraries.
|
||
|
|
Debugging both sides (the Java as well as Enso code) is possible with a decent
|
||
|
|
IDE.
|
||
|
|
|
||
|
|
Get [NetBeans](http://netbeans.apache.org) version 13 or newer or
|
||
|
|
[VS Code with Apache Language Server extension](https://cwiki.apache.org/confluence/display/NETBEANS/Apache+NetBeans+Extension+for+Visual+Studio+Code)
|
||
|
|
and _start listening on port 5005_ with _Debug/Attach Debugger_ or by specifying
|
||
|
|
following debug configuration in VSCode:
|
||
|
|
|
||
|
|
```json
|
||
|
|
{
|
||
|
|
"name": "Listen to 5005",
|
||
|
|
"type": "java+",
|
||
|
|
"request": "attach",
|
||
|
|
"listen": "true",
|
||
|
|
"hostName": "localhost",
|
||
|
|
"port": "5005"
|
||
|
|
}
|
||
|
|
```
|
||
|
|
|
||
|
|
Then it is just about executing following Sbt command which builds CLI version
|
||
|
|
of the engine, launches it in debug mode and passes all other arguments to the
|
||
|
|
started process:
|
||
|
|
|
||
|
|
```bash
|
||
|
|
sbt:enso> runEngineDistribution --debug --run ./test/Tests/src/Data/Numbers_Spec.enso
|
||
|
|
```
|
||
|
|
|
||
|
|
Alternatively you can pass in special JVM arguments when launching the
|
||
|
|
`bin/enso` launcher:
|
||
|
|
|
||
|
|
```bash
|
||
|
|
enso$ JAVA_OPTS=-agentlib:jdwp=transport=dt_socket,server=n,address=5005 ./built-distribution/enso-engine-*/enso-*/bin/enso --run ./test/Tests/src/Data/Numbers_Spec.enso
|
||
|
|
```
|
||
|
|
|
||
|
|
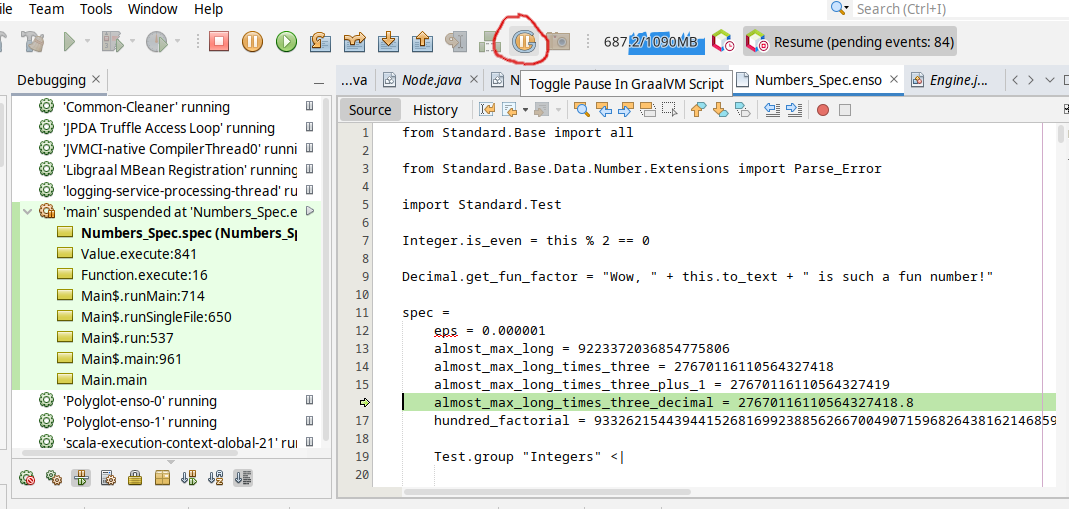
As soon as the debuggee connects and the Enso language starts - choose the
|
||
|
|
_Toggle Pause in GraalVM Script_ button in the toolbar:
|
||
|
|
|
||
|
|

|
||
|
|
|
||
|
|
and your execution shall stop on the next `.enso` line of code. This mode allows
|
||
|
|
to debug both - the Enso code as well as Java code. The stack traces shows a
|
||
|
|
mixture of Java and Enso stack frames by default. Right-clicking on the thread
|
||
|
|
allows one to switch to plain Java view (with a way more stack frames) and back.
|
||
|
|
Analyzing low level details as well as Enso developer point of view shall be
|
||
|
|
simple with such tool.
|