7.1 KiB
High & Low Runtime Debugging
This document describes how to debug everything - e.g. how to debug the Java code that powers the Enso engine & interpreter as well as Enso standard libraries Java code (used to interact with the operating system via Java APIs). At the same thetime the document describes how to map that information onto the execution of the actual Enso source code being interpreted.
Debugging Single Source File
To analyze what is happening in the interpreter, we often want to debug excecution of a single Enso file.
Get started by building the Engine distribution built with
sbt buildEngineDistribution command. Then configure your IDE to understand the
engine Java & Scala sources which are mostly located in the
engine subdirectory. The
sources are known to be understandable by:
- VSCode - with Enso Extension described herein
- IntelliJ
- IGV - with extension described herein
- NetBeans - with the same extension as IGV is using
There are two ways to start JVM in a debug mode. The first one is fully
integrated into the sbt build system. It builds the engine (in case there were
any changes) and then starts the JVM in debug mode trying to attach to port
5005:
sbt:enso> runEngineDistribution --debug --run ./test/Base_Tests/src/Data/Numbers_Spec.enso
The second options gives one a complete control as it launches everything from a
command line. By specifying JAVA_OPTS environment variable one influences the
special JVM arguments when launching the bin/enso from the engine
distribution:
enso$ JAVA_OPTS=-agentlib:jdwp=transport=dt_socket,server=n,address=5005 ./built-distribution/enso-engine-*/enso-*/bin/enso --run ./test/Base_Tests/src/Data/Numbers_Spec.enso
Both of the approaches launch the JVM in a debug mode. Once the JVM is
started, simply attach the debugger to the JVM process at the specified port
(usually 5005 is used).
Attaching from VSCode
First of all make sure your VSCode contains the Enso supporting extension. Follow the instructions provided herein to install everything that's needed.
Once the Enso extension is installed, open the root of Enso repository as workspace and select "Listen to 5005" debug configuration:
Once the connection with the Enso JVM is made, debug the Java code as usual.
Mapping Java and Enso Code
The Enso interpreter maintains a mapping between its Java code and appropriate Enso Code internally. It shall be no problem to use that information in the debugger. All the mentioned IDEs (alas except IntelliJ) support such mixed debugging of Java and Enso code.
Put a breakpoint into .enso file and after a while the breakpoint is hit and
one can inspect variables, step over the Enso statements and more...
...as one can seamlessly switch to debugging on the Enso interpreter itself! One
can place breakpoint into Java class like PanicException.java and continue
debugging with F5:
Should one ever want to jump back from Java to Enso one can use the "Pause in
GraalVM Script" action. Select it and continue with F5 - as soon as the code
reaches a statement in Enso, it stops:
Similar behavior to VSCode is available in IGV and NetBeans. Understanding both the engine Java code as well as Enso Code shall be pretty simple with these tools. For example NetBeans offers Toggle Pause in GraalVM Script button in the toolbar:
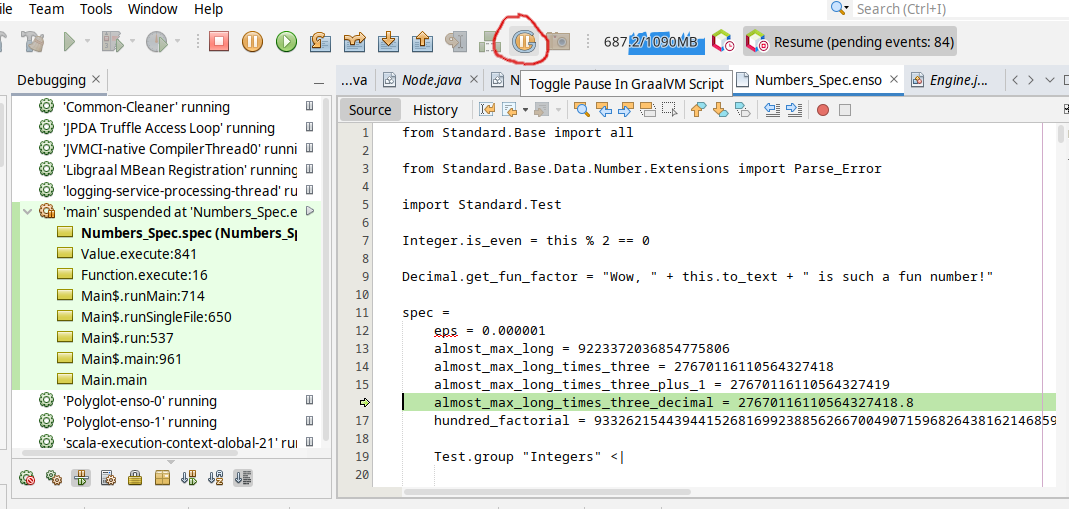
and your execution shall stop on the next .enso line of code.
These advanced developer tools allow one to debug both - the Enso code as well as Java code. The stack traces shows a mixture of Java and Enso stack frames by default. Right-clicking on the thread allows one to switch to plain Java view (with a way more stack frames) and back. Analyzing low level details as well as Enso developer point of view shall be simple with such tool.
Tips and Tricks (for poor IntelliJ users)
Finding the mapping of the Enso source code to the engine's Java code in IntelliJ isn't easy. Trying to find out how to debug a specific expression is way more tricky than in case of VSCode, IGV or NetBeans. However, if you really want to stick with IntelliJ as your only tool, following steps may help you to skip all the irrelevant code and get to the code you are interested in:
- To get the mapping to Enso source code, evaluate the following expression in
the Java debugger:
this.getRootNode().getSourceSection(). Note that this, obviously, works only when the debugger is stopped in some Truffle node code. - To debug a method called
foo, put a breakpoint inorg.enso.interpreter.node.ClosureRootNode#executewith a condition onthis.name.contains("foo") - To debug a specific expression, put some unique expression, like
Debug.eval "1+1", in front of it and put a breakpoint in a Truffle node corresponding to that unique expression, in this case that isorg.enso.interpreter.node.expression.builtin.debug.DebugEvalNode.
Debugging annotation processors
The Engine uses annotation processors to generate some of the Java code, e.g.,
the builtin methods with org.enso.interpreter.dsl.MethodProcessor, or JMH
benchmark sources with org.enso.benchmarks.processor.BenchProcessor.
Annotation processors are invoked by the Java compiler (javac), therefore, we
need special instructions to attach the debugger to them.
Let's debug org.enso.interpreter.dsl.MethodProcessor as an example. The
following are the commands invoked in the sbt shell:
project runtimeclean- Delete all the compiled class files along with all the generated sources by the annotation processor. This ensures that the annotation processor will be invoked.
set javacOptions += FrgaalJavaCompiler.debugArg- This sets a special flag that is passed to the frgaal Java compiler, which in turn waits for the debugger to attach. Note that this setting is not persisted and will be reset once the project is reloaded.
compile- Launches the Java compiler, which will wait for the debugger to attach. Put
a breakpoint in some class of
org.enso.interpreter.dslpackage. Wait for the message in the console instructing to attach the debugger.
- Launches the Java compiler, which will wait for the debugger to attach. Put
a breakpoint in some class of
- To reset the
javacOptionssetting, either runset javacOptions -= FrgaalJavaCompiler.debugArg, or reload the project withreload.