mirror of
https://github.com/enso-org/enso.git
synced 2024-12-24 05:12:31 +03:00
Start `project-manager` with following options to provide first 20s of the startup sequence:
```
$ project-manager --profiling-events-log-path=start.log --profiling-path=start.npss --profiling-time=20
```
once the `start.log` and `start.npss` files are generated (next to each other), open them in GraalVM's VisualVM:
```
$ graalvm/bin/jvisualvm --openfile start.npss
```
analyze.
43 lines
1.7 KiB
Markdown
43 lines
1.7 KiB
Markdown
# Summary
|
|
|
|
One of the main objectives to deliver satisfactory user experience when using
|
|
Enso is to be fast when getting ready to work. This requires the engine to
|
|
initialize all services the IDE needs in proper order and to make sure the
|
|
essential ones are ready as quickly as possible. In short - to **start fast**.
|
|
This document describes how to measure, record and analyze the startup of the
|
|
Enso engine.
|
|
|
|
## Collecting the data
|
|
|
|
Start `project-manager` with following options to record first 20s of the Enso
|
|
engine startup sequence:
|
|
|
|
```
|
|
$ project-manager --profiling-events-log-path=start.log --profiling-path=start.npss --profiling-time=20
|
|
```
|
|
|
|
Let the IDE connect to just launched `project-manager` - e.g. start the IDE with
|
|
`--no-backed` option. Once the `start.log` and `start.npss` files are generated
|
|
(next to each other), open them in GraalVM's VisualVM:
|
|
|
|
```
|
|
$ graalvm/bin/jvisualvm --openfile start.npss
|
|
```
|
|
|
|
Use VisualVM to analyze to recorded data.
|
|
|
|
### Interactively Analyze
|
|
|
|
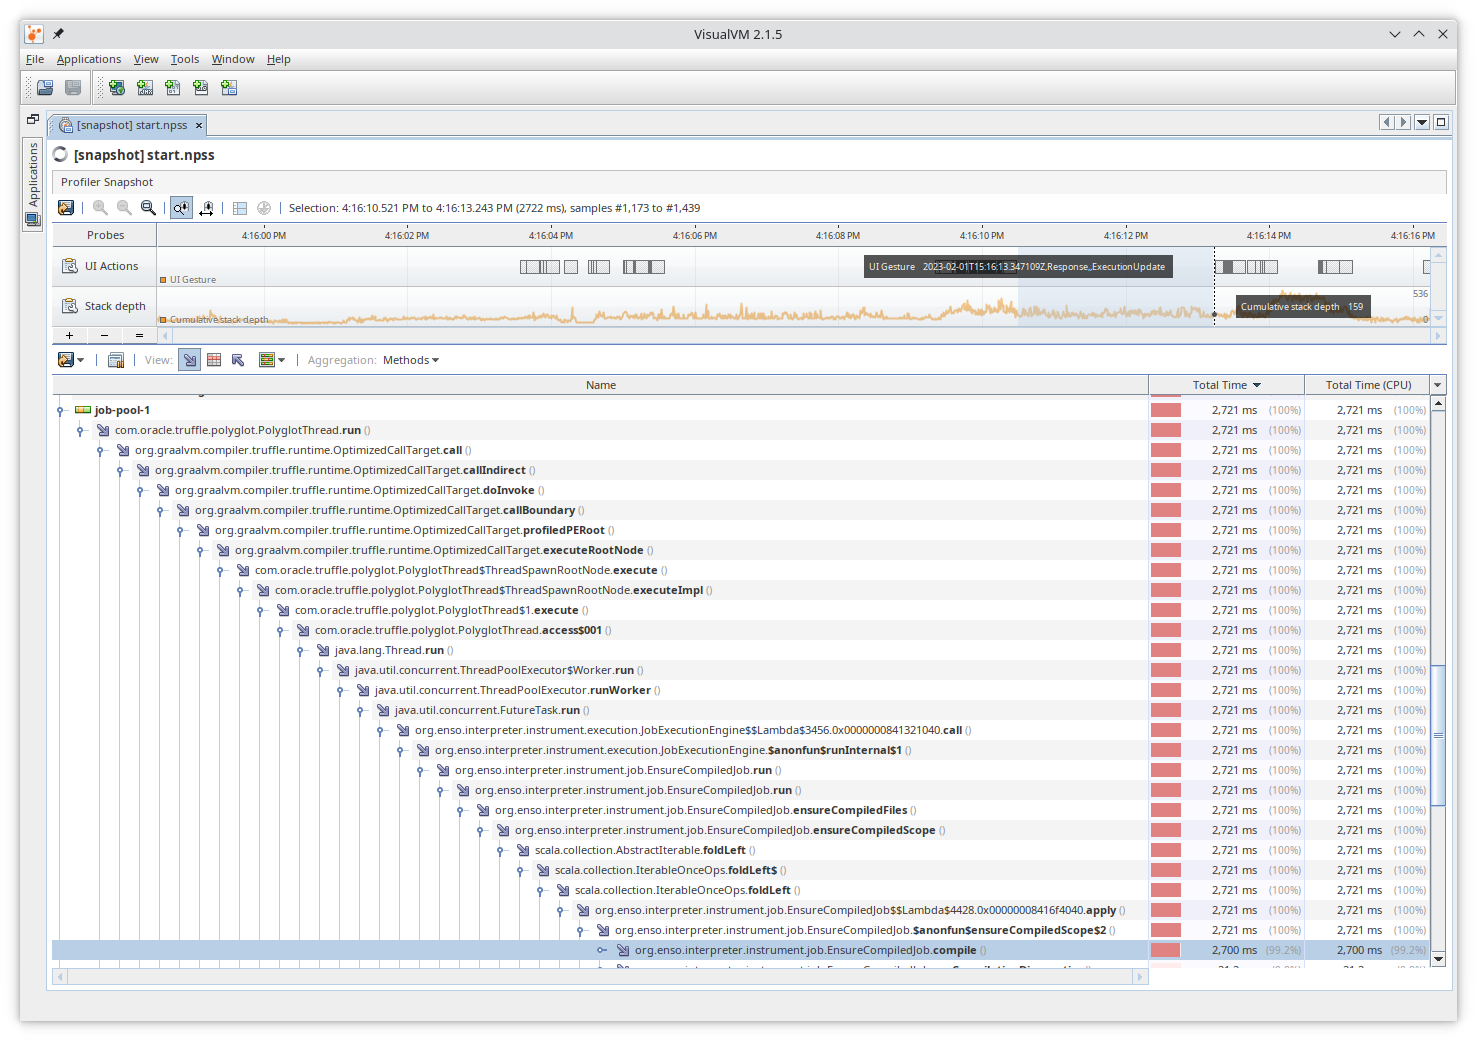
VisualVM offers two timelines. A "stackdepth" one and also _"UI Actions"_ line.
|
|
Hovering over boxes in _"UI Actions"_ shows the messages describing what happens
|
|
in the engine - what has been logged into `start.log`. One can then select an
|
|
interval and get profiling information for that interval:
|
|
|
|

|
|
|
|
This picture shows that 2.7s is spend in `EnsoCompiledJob` task. Overall the
|
|
goal is to log enough information to help us navigate thru the long startup
|
|
sequence. Select appropriate interval based on the displayed _UI Actions_ - e.g.
|
|
logged events - and analyze what has happened there based on the sampling of JVM
|
|
stack traces.
|