mirror of
https://github.com/enso-org/enso.git
synced 2024-12-21 03:41:47 +03:00
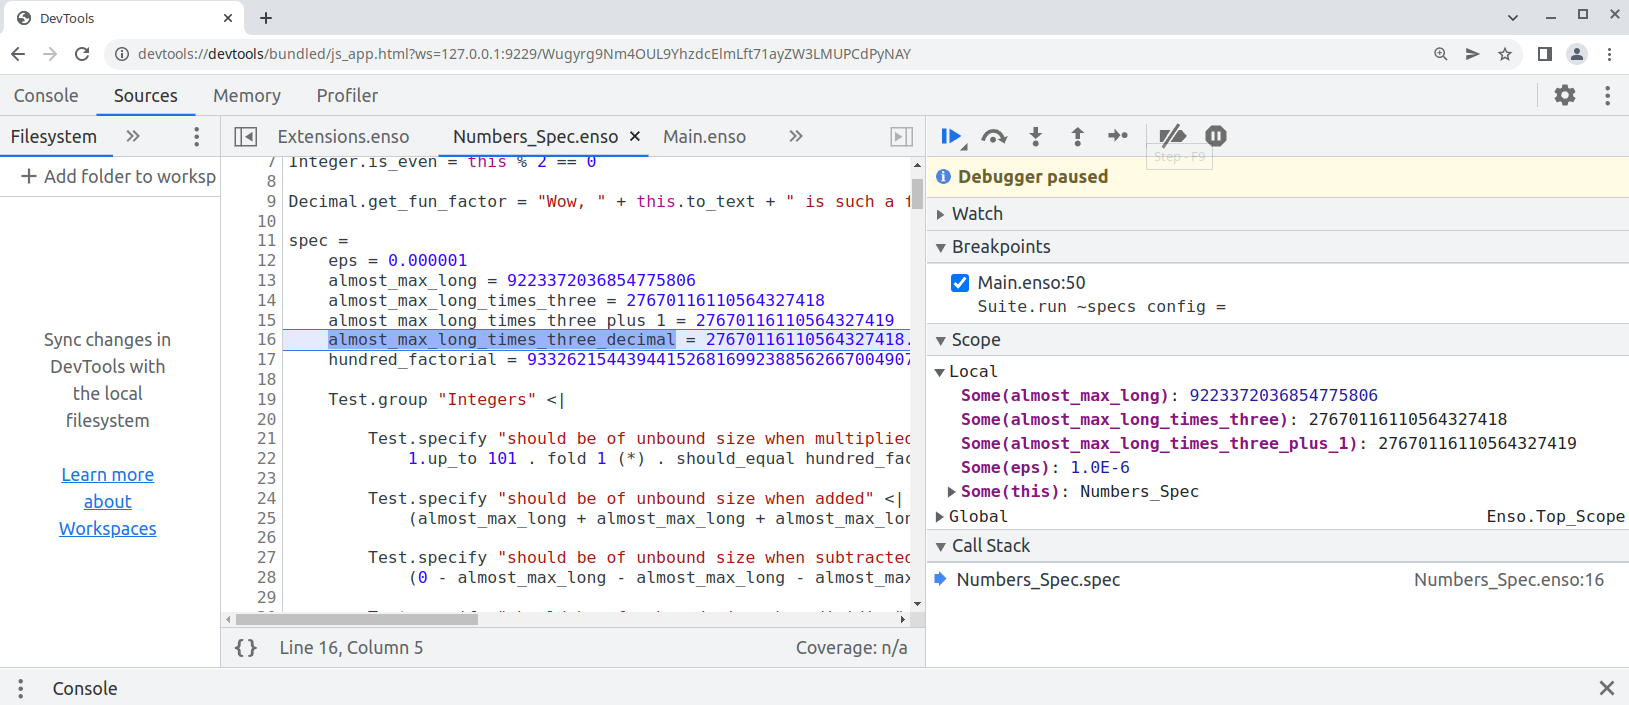
Finally this pull request proposes `--inspect` option to allow [debugging of `.enso`](e948f2535f/docs/debugger/README.md) in Chrome Developer Tools:
```bash
enso$ ./built-distribution/enso-engine-0.0.0-dev-linux-amd64/enso-0.0.0-dev/bin/enso --inspect --run ./test/Tests/src/Data/Numbers_Spec.enso
Debugger listening on ws://127.0.0.1:9229/Wugyrg9Nm4OUL9YhzdcElmLft71ayZW3LMUPCdPyNAY
For help, see: https://www.graalvm.org/tools/chrome-debugger
E.g. in Chrome open: devtools://devtools/bundled/js_app.html?ws=127.0.0.1:9229/Wugyrg9Nm4OUL9YhzdcElmLft71ayZW3LMUPCdPyNAY
```
copy the printed URL into chrome browser and you should see:

One can also debug the `.enso` files in NetBeans or [VS Code with Apache Language Server extension](https://cwiki.apache.org/confluence/display/NETBEANS/Apache+NetBeans+Extension+for+Visual+Studio+Code) just pass in special JVM arguments:
```bash
enso$ JAVA_OPTS=-agentlib:jdwp=transport=dt_socket,server=y,address=8000 ./built-distribution/enso-engine-0.0.0-dev-linux-amd64/enso-0.0.0-dev/bin/enso --run ./test/Tests/src/Data/Numbers_Spec.enso
Listening for transport dt_socket at address: 8000
```
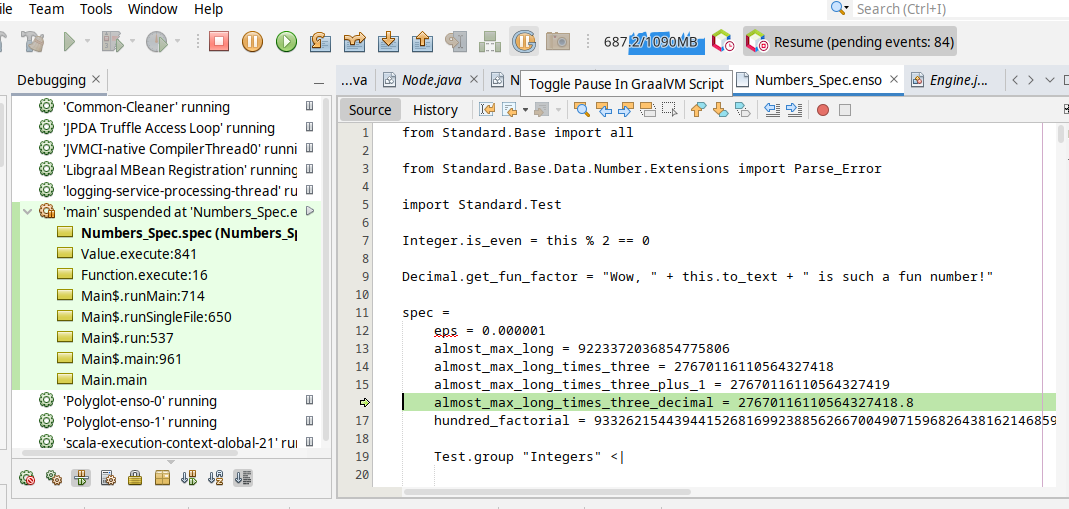
and then _Debug/Attach Debugger_. Once connected choose the _Toggle Pause in GraalVM Script_ button in the toolbar (the "G" button):

and your execution shall stop on the next `.enso` line of code. This mode allows to debug both - the Enso code as well as Java code.
Originally started as an attempt to write test in Java:
* test written in Java
* support for JUnit in `build.sbt`
* compile Java with `-g` - so it can be debugged
* Implementation of `StatementNode` - only gets created when `materialize` request gets to `BlockNode`
71 lines
2.8 KiB
Markdown
71 lines
2.8 KiB
Markdown
---
|
|
layout: section-summary
|
|
title: Debugger
|
|
category: debugger
|
|
tags: [debugger, repl, readme]
|
|
order: 0
|
|
---
|
|
|
|
# Enso Debugger
|
|
|
|
The Enso Debugger allows amongst other things, to execute arbitrary expressions
|
|
in a given execution context - this is used to implement a debugging REPL. The
|
|
REPL can be launched when triggering a breakpoint in the code.
|
|
|
|
This folder contains all documentation pertaining to the REPL and the debugger,
|
|
which is broken up as follows:
|
|
|
|
- [**The Enso Debugger Protocol:**](./protocol.md) The protocol for the Debugger
|
|
|
|
# Chrome Developer Tools Debugger
|
|
|
|
As a well written citizen of the [GraalVM](http://graalvm.org) project the Enso
|
|
language can be used with existing tools available for the overall platform. One
|
|
of them is
|
|
[Chrome Debugger](https://www.graalvm.org/22.1/tools/chrome-debugger/) and Enso
|
|
language is fully integrated with it. Launch the `bin/enso` executable with
|
|
additional `--inspect` option and debug your Enso programs in _Chrome Developer
|
|
Tools_.
|
|
|
|
```bash
|
|
enso$ ./built-distribution/enso-engine-*/enso-*/bin/enso --inspect --run ./test/Tests/src/Data/Numbers_Spec.enso
|
|
Debugger listening on ws://127.0.0.1:9229/Wugyrg9
|
|
For help, see: https://www.graalvm.org/tools/chrome-debugger
|
|
E.g. in Chrome open: devtools://devtools/bundled/js_app.html?ws=127.0.0.1:9229/Wugyrg9
|
|
```
|
|
|
|
copy the printed URL into chrome browser and you should see:
|
|
|
|

|
|
|
|
Step in, step over, set breakpoints, watch values of your variables as execution
|
|
of your Enso program progresses.
|
|
|
|
# Debugging Enso and Java Code at Once
|
|
|
|
Enso libraries are written in a mixture of Enso code and Java libraries.
|
|
Debugging both sides (the Java as well as Enso code) is possible with a decent
|
|
IDE.
|
|
|
|
Get [NetBeans](http://netbeans.apache.org) version 13 or newer or
|
|
[VS Code with Apache Language Server extension](https://cwiki.apache.org/confluence/display/NETBEANS/Apache+NetBeans+Extension+for+Visual+Studio+Code)
|
|
and just pass in special JVM arguments when launching the `bin/enso` launcher:
|
|
|
|
```bash
|
|
enso$ JAVA_OPTS=-agentlib:jdwp=transport=dt_socket,server=y,address=8000 ./built-distribution/enso-engine-*/enso-*/bin/enso --run ./test/Tests/src/Data/Numbers_Spec.enso
|
|
Listening for transport dt_socket at address: 8000
|
|
```
|
|
|
|
and then _Debug/Attach Debugger_. Once connected suspend the execution and (if
|
|
the Enso language has already been started) choose the _Toggle Pause in GraalVM
|
|
Script_ button in the toolbar:
|
|
|
|

|
|
|
|
and your execution shall stop on the next `.enso` line of code. This mode allows
|
|
to debug both - the Enso code as well as Java code. The stack traces shows a
|
|
mixture of Java and Enso stack frames by default. Right-clicking on the thread
|
|
allows one to switch to plain Java view (with a way more stack frames) and back.
|
|
Analyzing low level details as well as Enso developer point of view shall be
|
|
simple with such tool.
|