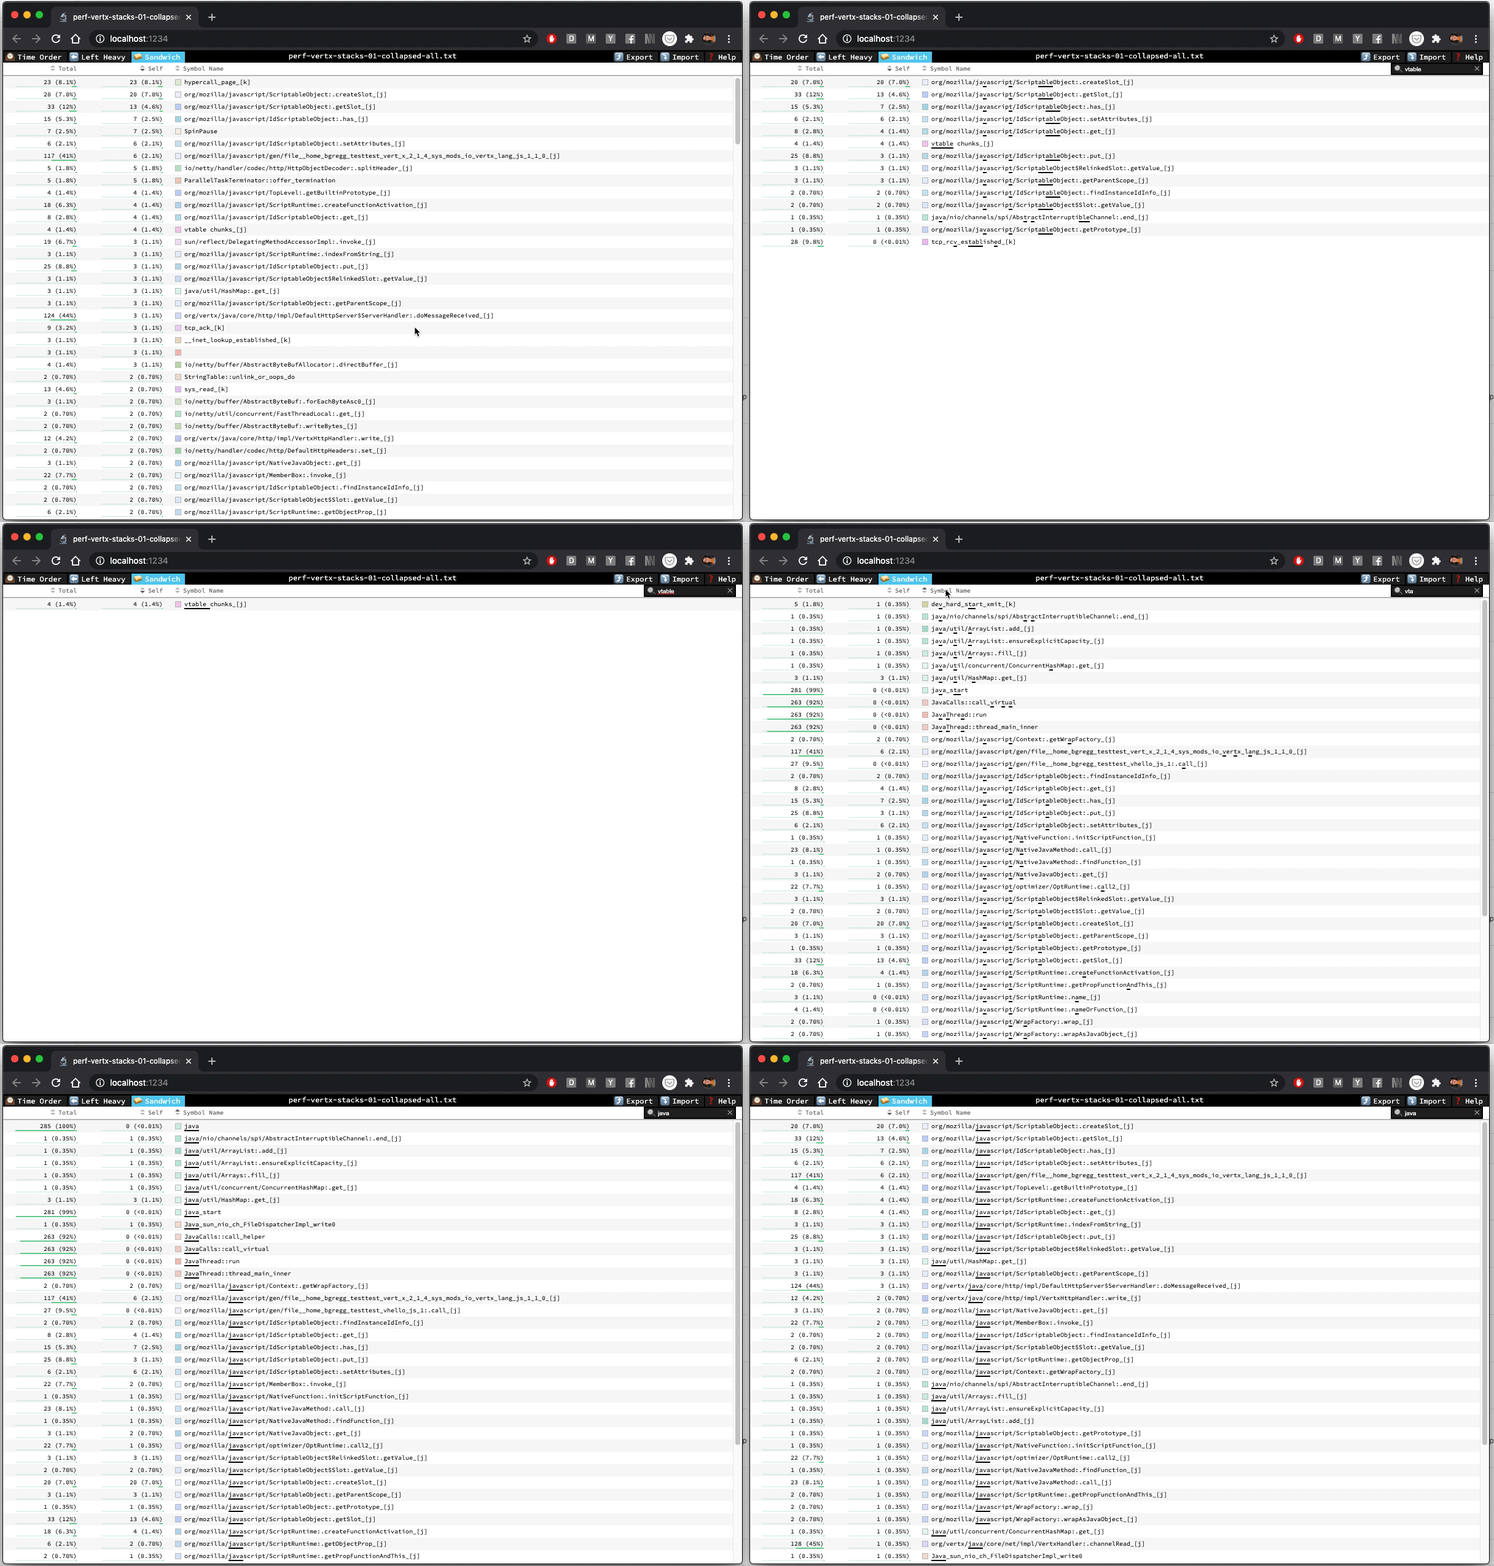
This is the first step towards fixing #38.
I started with the easiest part from a UI-paradigm perspective, and also the place that's the most confusing that search doesn't work. Before this PR, browers' Cmd+F/Ctrl+F would *look* like it worked in the Sandwich view, but they wouldn't work fully because the view in the sandwich view is a virtualized table, meaning that it doesn't put all of the rows in the DOM. Instead, it only renders enough to fill the viewport to make rendering much faster.
Here's what the changes from this PR look like in action:

Before closing #38, I'll be adding search functionality to the flamechart views too.
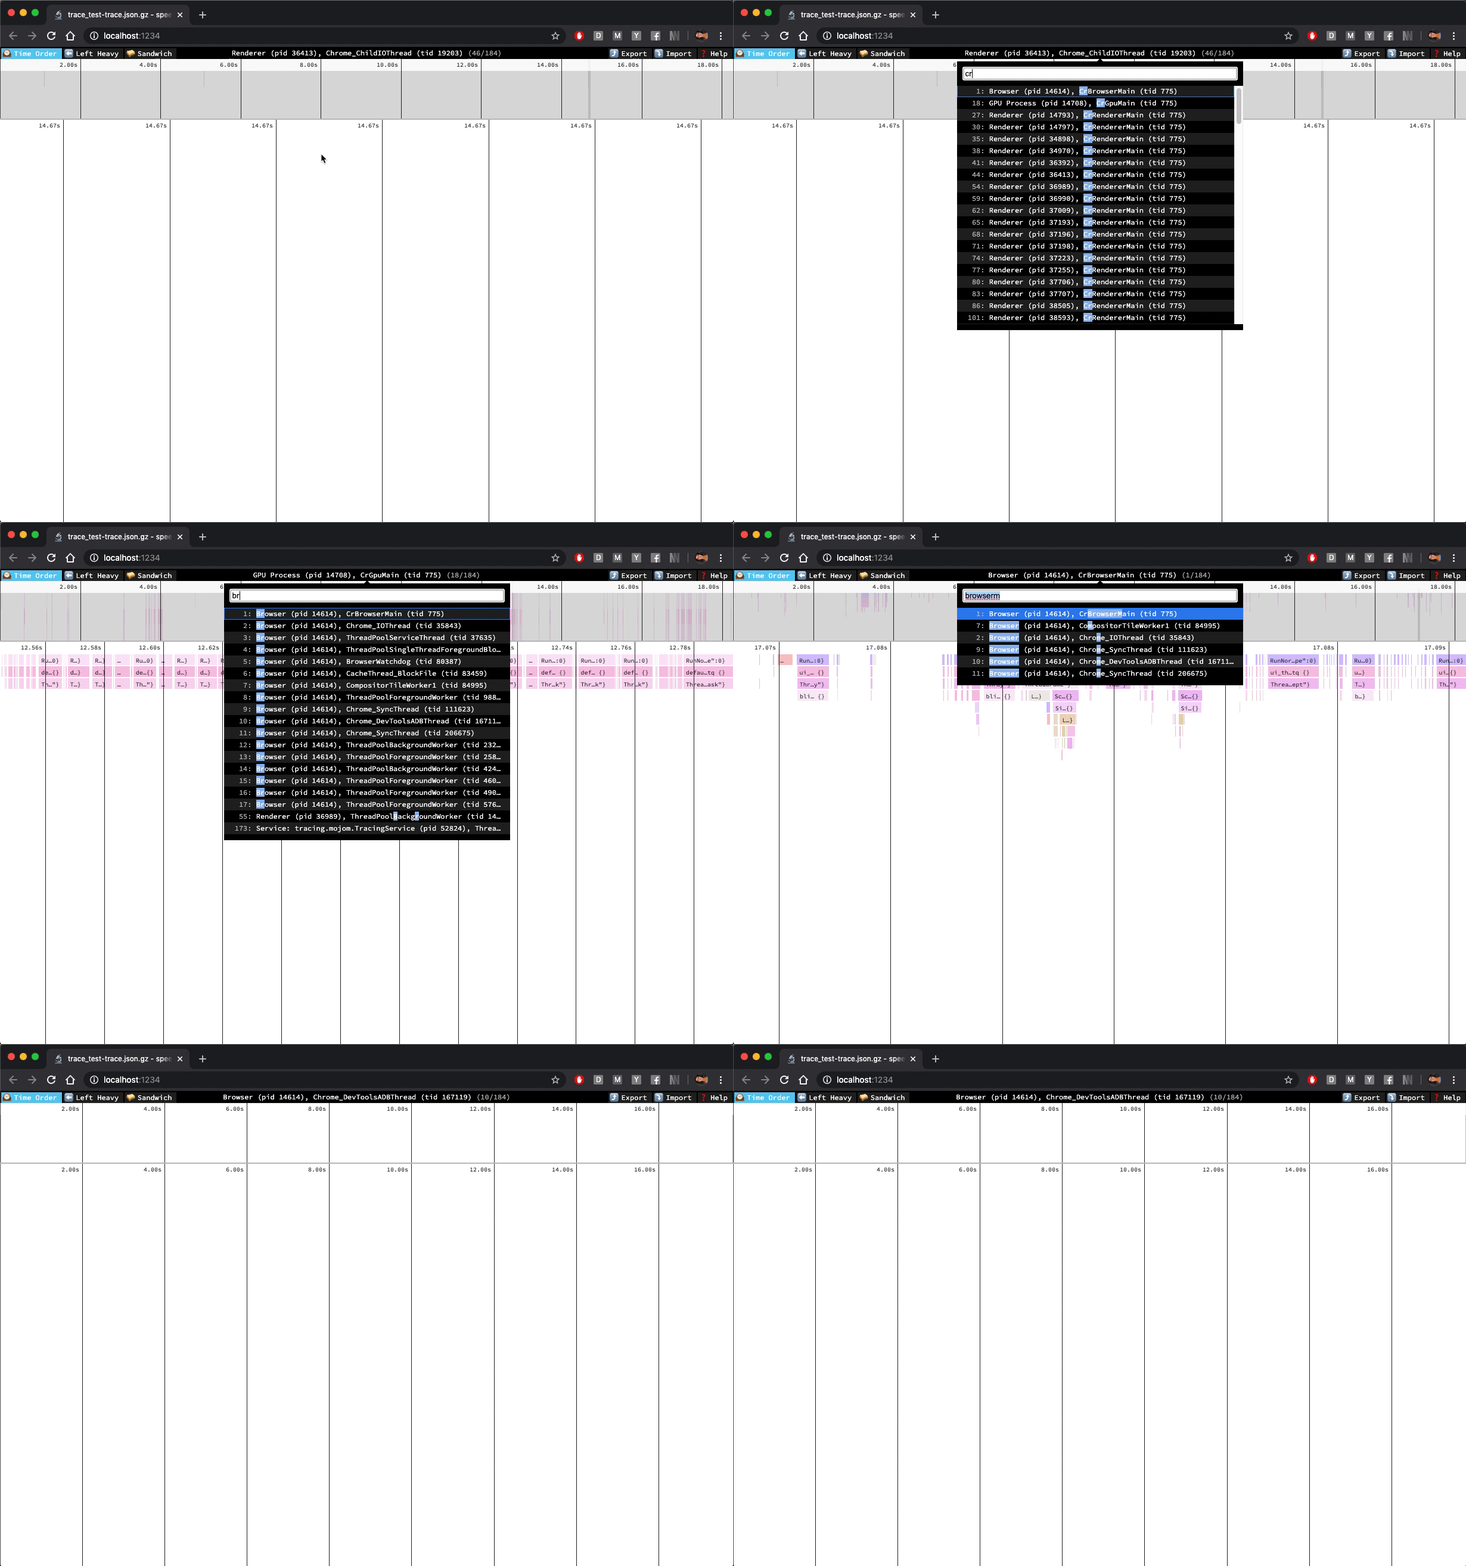
This adds much better UI for selecting different profiles within a single import.

You can now hover over the middle of the toolbar or hit `t` on your keyboard to bring up the profile selector. From there, you can use fuzzy-find to switch to the profile you want, and hit "enter" to select it. The up and down arrow keys can be used while the profile selector filter input is focused to move through the list of profiles.
I think the "next" and "prev" buttons are now totally useless, so I removed them.
Fixes#167
Profile switching was subtly broken because action creators weren't being correctly re-bound due to a missing dependency in a `useCallback` call.
I also tried to reduce boilerplate in this PR by adding additional exhaustive deps protection via eslint for `useSelector`, `useAppSelector`, and `useActionCreator`. The removes the need for using `useCallback` or each of those.
Fixes#280
To test this, load a profile, then save a `.tsx` file locally. Before this change, it would bring you back to the welcome screen after hot reload. After this change, application state is still displayed. This is because before the change, the `setGLCanvas` action wasn't resulting in a re-render because it occurred between the initial render and the `useLayoutEffect` callback.
Fixes#276
I'd like to try writing new components using hooks, and to do that I need to upgrade from preact 8 to preact X.

For reasons that are... complicated, in order to upgrade without breaking part of my build process, I had to remove the dependency on `preact-redux` altogether. This led me to write my own implementation, and as part of that I realized I could remove `createContainer` in favour of some simple hooks that use redux.

Before landing:
- [x] Investigate performance issues in the sandwich views
- [x] Investigate es-lint checks for exhaustive hook dependencies
Fixes#268
I fixed it by dropping the dependency on quicktype entirely, and using its dependency directly. I still don't understand why the version of typescript used in this repository affects what quicktype is doing, but it seems like the issue is in quicktype, not its dependency.
I validated this change was correct by diffing the output of `node scripts/generate-file-format-schema-json.js` with what's currently on http://speedscope.app/file-format-schema.json. There's no difference.
This PR also includes changes to the CI script to ensure that we can catch this before hitting master next time.
@JustinBeckwith pointed out in #262 that `npm install` was broken in node 13.x, and @DanielRuf pointed in #254 that test fail for node 11+ because of a change to stability of sorting.

This PR seeks to address both of those.

The installation issue was fixed by just regenerating `package-lock.json` without needing to bump any of the direct dependency versions. The test failure issue requires manual intervention.

To fix the sort stability issue, I updated the tests to use the stable sort values (these were all the correct values, though some of the test values were incorrect).

To make the suite still pass for node 10, I added a hack where I override `Array.prototype.sort` with a stable implementation that's *only* used in tests (See comments in code for a justification for why)

## Test Plan

Before this PR: `npm install` on node 13.x fails & `npm run jest` results in test failures
After this PR: `npm install` on node 13.x passes & `npm run jest` passes for node 10, 12, and 13.
I ended up in a horrible peer dependency hell and apparently needed to bump the versions of quicktype, typescript, ts-jest, *and* jest to get out of it. But I think I got out of it!

Local builds and deployment builds both seem to work after these changes.
The code to import trace formatted events intentionally re-orders events in order to make it easier at flamegraph construction time to order the pushes and pops of frames.

It turns out that this re-ordering results in incorrect flamegraphs being generated as shown in #251.

This PR fixes this by avoiding re-ordering in situations where it isn't necessary.
Apparently Emscripten now generates `.symbols` files where names are not mangled using Clang's mangling scheme, but rather hex-escaped! So 'a\20b' means 'a b'. Currently we can't import these symbol maps into Speedscope because a regex rejects them, and they look weird because we don't unescape.
This PR introduces support for importing JSON based profiles that are missing a terminating `]` (and possibly have an extraneous `,`).
This is similar to #202, but takes a much more targeted and simple approach.
I'm confident that this approach is sufficient because this is exactly what `chrome://tracing` does: 27e047e049/tracing/tracing/extras/importer/trace_event_importer.html (L197-L208)Fixes#204
In #194, I added code to support import of multithreaded profiles from Chrome 70. I'm now doing some profiling work on an older version of Android chrome, and it seems like the profile objects don't yet have `id` properties. Instead, we should try using the `pid/tid` pair to identify profiles when the `id` field is absent.

This was tested against a profile import from Android Chrome 66.
this's will lack `com.apple.xray.owner.template` in instruments archive data where run instruments with command line.
like:
1. run`instruments -t Template.tracetemplate -D demo.trace -l 10000 -w  test.app`
2. drag `demo.trace` into `https://www.speedscope.app`
3. alert `Unrecognized format! See documentation about supported formats`
The spec for the Trace Event Format technically requires that all entries have "ts" values, and they do in the profiles recorded using chrome://tracing. We don't actually use those values in the case of "M" (metadata) events, however, and they're semantically meaningless as far as I can tell, so let's stop requiring them.
This allows the files that @aras-p provided in #77 to import successfully.
Fixes#77
This PR implements basic import of profiles from the "Trace Event Format", which is used by `chrome://tracing`, but also which many other tools target as a convenient event tracing format. The spec can be found here: https://docs.google.com/document/d/1CvAClvFfyA5R-PhYUmn5OOQtYMH4h6I0nSsKchNAySU/preview#heading=h.xqopa5m0e28f.
The standard supports a broad set of events, some of which don't yet have any practical way to visualize them in speedscope. This PR implements support for the `B`, `E`, and `X` events, as well as gathering process and thread names via some of the `M` events.
This work was motivated by a generous donation to /dev/color by @aras-p: https://github.com/jlfwong/speedscope/issues/77#issuecomment-455077014Fixes#77
In #160, I wrote code which incorrectly assumed that at most one profile would be active at a time. It turns out this assumption is incorrect because of webworkers! This PR introduces a fix which correctly separates samples taken on the main thread from samples taken on worker threads, and allows viewing both in speedscope.
Fixes#171
#165 introduced a performance regression by using a really inefficient method for converting from array buffers into string. This should ix it by using `TextDecoder` instead.
Fixes#182 by adding support for importing the JSON profiling format created by GHC's built in profiling support when the executable is passed the `-pj` option. Produces a profile group containing both a time and allocation profile.
Unfortunately, GHC doesn't provide the raw sample information to get the time view to be useful, so only left heavy and sandwich are useful.
Includes a test profile, and I've also tested it on a more real large 2MB profile file in the UI and it works great.
I also modified the Readme to link to a wiki page I'm unable to create, but that should have something like this content copy-pasted into it:
# Importing from Haskell
GHC provides built in profiling support that can export a JSON file.
In order to do this you need to compile your executable with profiling
support and then pass the `-pj` RTS flag to the executable.
This will produce a `my-binary.prof` file in the current directory which
you can import into speedscope.
## Using GHC
See the [GHC manual page on profiling](https://downloads.haskell.org/~ghc/latest/docs/html/users_guide/profiling.html)
for more extensive information on the command line flags available.
```
$ ghc -prof -fprof-auto -rtsopts Main.hs
$ ./Main +RTS -pj -RTS
```
## Using Stack
### With executables
```
$ stack build --profile
$ stack exec -- my-executable +RTS -pj -RTS
```
### With tests
```
stack test --profile --test-arguments "+RTS -pj -RTS"
```
When using #profileURL, some binary characters cannot be read if we use `fetch text`. So I changed that to use `arrayBuffer`.

Now we can read pprof protobuf files and normal JSON files instead of only text files.