mirror of
https://github.com/jlfwong/speedscope.git
synced 2024-10-06 23:27:34 +03:00
127 lines
6.6 KiB
Markdown
127 lines
6.6 KiB
Markdown
简体中文 | [English](./README.md)
|
||
# 🔬speedscope
|
||
|
||
一个快速,交互式,基于网络的性能分析工具。 [FlameGraphs][1](火焰图)的另一个替代品。它可以轻松显示数兆的配置文件并且不会使浏览器崩溃。
|
||
|
||
给定原始分析数据,你就可以交互式的探索数据,了解应用程序中什么部分速度较慢,或者分配所有内存,或者对任何数据进行分析。
|
||
|
||
|
||
|
||
[0]: https://en.wikipedia.org/wiki/Profiling_(computer_programming)#Statistical_profilers
|
||
[1]: https://github.com/brendangregg/FlameGraph
|
||
|
||
# 使用
|
||
|
||
访问https://www.speedscope.app,上传文件或者拖拽到页面上。配置文件不会上传到任何地方——应用程序完全在浏览器中。
|
||
|
||
## 命令行中使用
|
||
|
||
为了方便在不联网的情况下或者在终端中使用, 你可以使用npm下载speedscope:
|
||
|
||
npm install -g speedscope
|
||
|
||
调用`speedscope /path/to/profile` 就可以在默认浏览器中加载speedscope。
|
||
|
||
## 独立使用
|
||
|
||
如果你不想使用npm或者node下载,你也可以在这里下载独立的版本https://github.com/jlfwong/speedscope/releases.
|
||
下载完一个版本的压缩文件之后,解压并在谷歌或者火狐浏览器中打开`index.html`文件即可。
|
||
|
||
## 支持的文件格式
|
||
|
||
Speedscope可以不同编程语言和环境的各种不同探查器中摄取概要文件。单击下面的链接获取从特定源导入的文档。
|
||
|
||
- JavaScript
|
||
- [从 Chrome 导入](https://github.com/jlfwong/speedscope/wiki/Importing-from-Chrome)
|
||
- [从 Firefox 导入](https://github.com/jlfwong/speedscope/wiki/Importing-from-Firefox)
|
||
- [从 Safari 导入](https://github.com/jlfwong/speedscope/wiki/Importing-from-Safari)
|
||
- [从 Node.js 导入](https://github.com/jlfwong/speedscope/wiki/Importing-from-Node.js)
|
||
- Ruby
|
||
- [从 stackprof 导入](https://github.com/jlfwong/speedscope/wiki/Importing-from-stackprof-(ruby))
|
||
- [从 rbspy 导入](https://github.com/jlfwong/speedscope/wiki/Importing-from-rbspy-(ruby))
|
||
- [从 ruby-prof 导入](https://github.com/jlfwong/speedscope/wiki/Importing-from-ruby-prof)
|
||
- Python
|
||
- [从 py-spy 导入](https://github.com/jlfwong/speedscope/wiki/Importing-from-py-spy-(python))
|
||
- [pyspeedscope](https://github.com/windelbouwman/pyspeedscope)
|
||
- [从 Austin 导入](https://github.com/P403n1x87/austin-python#format-conversion)
|
||
- [从 pyinstrument 导入](https://github.com/jlfwong/speedscope/wiki/Importing-from-pyinstrument-(python))
|
||
- PHP
|
||
- [从 phpspy 或者 sj-i/php-profiler 导入](https://github.com/sj-i/php-profiler/pull/101)
|
||
- Go
|
||
- [从 pprof 导入](https://github.com/jlfwong/speedscope/wiki/Importing-from-pprof-(go))
|
||
- Rust
|
||
- [flamescope](https://github.com/coolreader18/flamescope)
|
||
- Native code
|
||
- [从 Instruments.app 导入](https://github.com/jlfwong/speedscope/wiki/Importing-from-Instruments.app) (macOS)
|
||
- [从 `perf` 导入](https://github.com/jlfwong/speedscope/wiki/Importing-from-perf-(linux)) (linux)
|
||
- [从 .NET Core 导入](https://github.com/jlfwong/speedscope/wiki/Importing-from-.NET-Core)
|
||
- [从 GHC (Haskell) 导入](https://github.com/jlfwong/speedscope/wiki/Importing-from-Haskell)
|
||
- [从 custom sources 导入](https://github.com/jlfwong/speedscope/wiki/Importing-from-custom-sources)
|
||
|
||
极力欢迎贡献添加对其他格式的支持!查看 issues ["import source" tag](https://github.com/jlfwong/speedscope/issues?q=is%3Aissue+is%3Aopen+label%3A%22import+source%22).
|
||
|
||
## 通过URL导入
|
||
|
||
要通过URL加载特定的配置文件,你可以添加一个这样的hash片段 `#profileURL=[URL-encoded profile URL]&title=[URL-encoded custom title]`. 注意:托管配置文件的服务器必须配置CORS以允许来自speedscope的AJAX请求。
|
||
|
||
## 页面
|
||
|
||
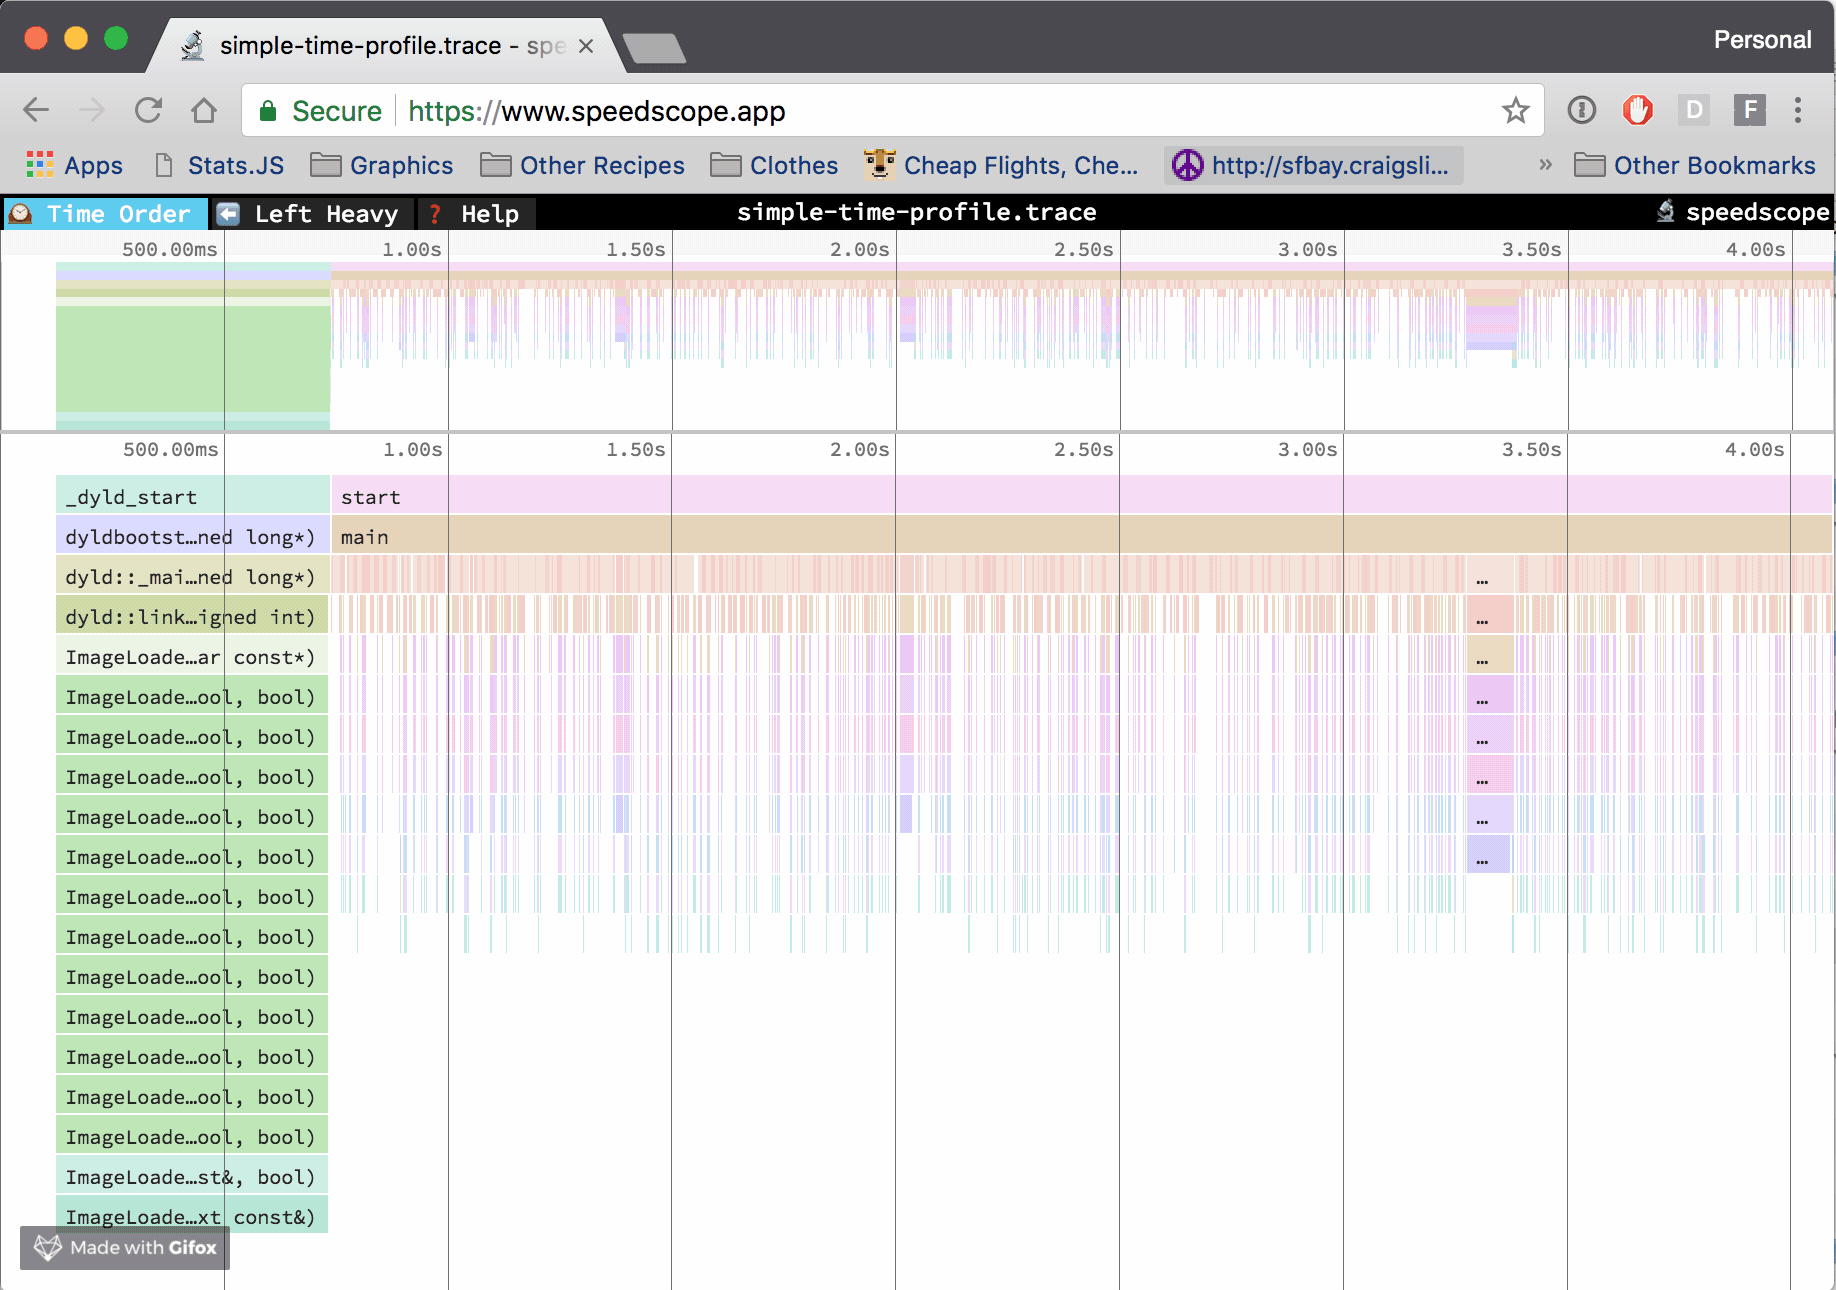
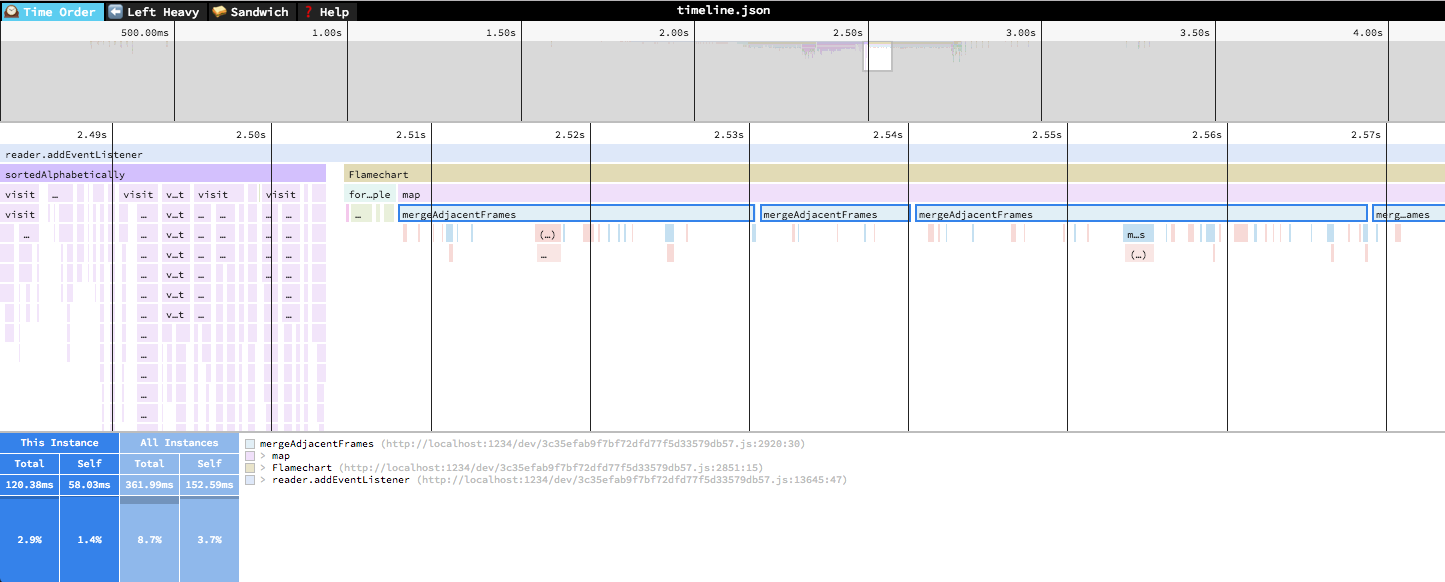
### 🕰Time Order
|
||
|
||
|
||
在 "Time Order" 页面 (默认),调用堆栈按照它们在输入文件中出现的顺序从左到右排列,这通常是安排它们被记录的时间顺序。这个视图对于理解应用程序随时间变化的行为非常有帮助,比如 "首次从数据库获取到数据,然后为序列化准备数据,数据被序列化为JSON"。
|
||
|
||
水平轴表示每个堆栈的“权重”(最常见的是CPU时间),垂直轴显示在运行期间处于活动状态的堆栈。如果你点击其中一个框,你将能够看到关于它的统计摘要。
|
||
|
||
|
||
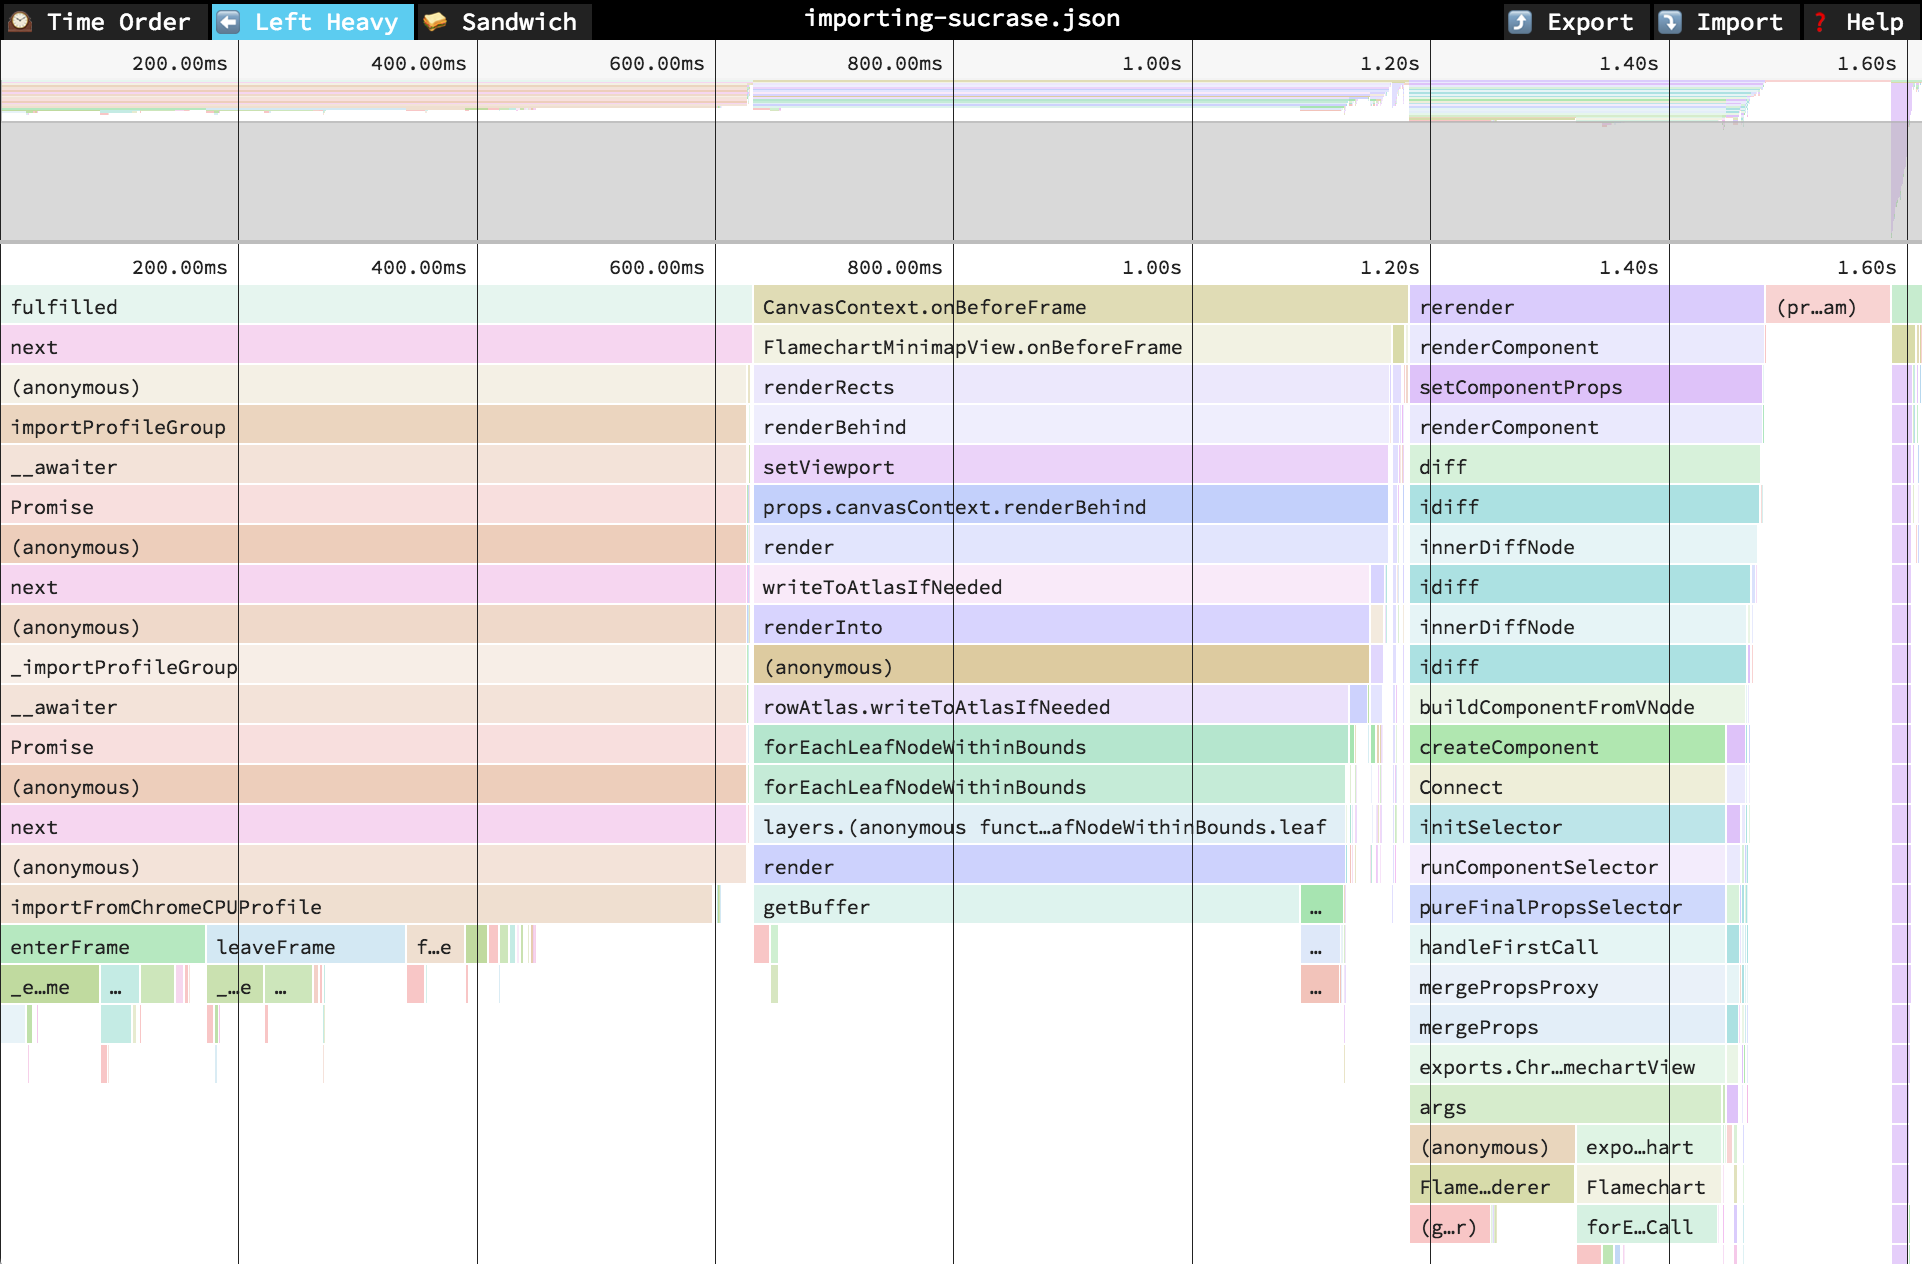
### ⬅️Left Heavy
|
||
|
||
|
||
在 "Left Heavy" 页面,将相同的堆栈分组在一,不管它们是否按顺序记录。然后,对堆栈进行排序,使每个父堆栈中最重的堆栈位于左侧——因此称为“左权重”。 这个视图对于理解在其他调用栈之间有成百上千个函数交错调用的情况下,时间都花费在了哪里很有用。
|
||
|
||
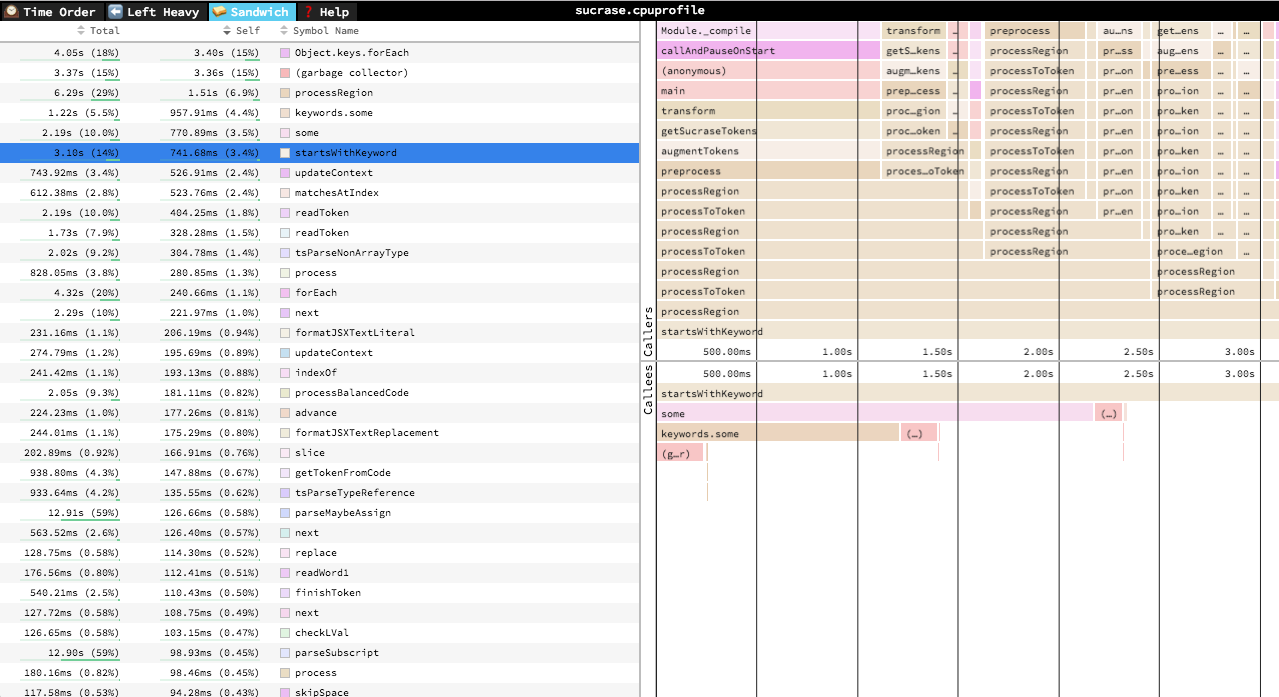
### 🥪 Sandwich
|
||
|
||
|
||
Sandwich 是一个表格视图,你可以在其中找到所有函数及其相关时间的列表。您可以按自己的时间或总时间排序。
|
||
之所以称为"Sandwich"视图,是因为如果你选择表中的某一行,就可以看到所选对象的所有调用者和被调用者的火焰图
|
||
。
|
||
|
||
|
||
## 导航
|
||
|
||
一旦配置文件被加载,主视图就会被分成两部分:顶部区域是“迷你地图”,底部区域是“堆栈视图”。
|
||
|
||
### 迷你地图导航
|
||
|
||
* 在任意一个轴上滚动以进行平移
|
||
* 单击并拖动可将视图缩小到特定范围
|
||
|
||
### 堆栈视图
|
||
|
||
* 在任意一个轴上滚动以进行平移
|
||
* 缩放
|
||
* 按住 Cmd+Scroll 进行缩放
|
||
* 双击一帧以使视口适应
|
||
* 点击一个框以查看关于它的摘要统计
|
||
|
||
### 键盘导航
|
||
|
||
* `+`: 放大
|
||
* `-`: 缩小
|
||
* `0`: 缩小以看到整体情况
|
||
* `w`/`a`/`s`/`d` 或者箭头键: pan around the profile
|
||
* `1`: 切换到 "Time Order" 视图
|
||
* `2`: 切换到 "Left Heavy" 视图
|
||
* `3`: 切换到 "Sandwich" 视图
|
||
* `r`: 在火焰图中折叠递归
|
||
* `Cmd+S`/`Ctrl+S` 保存现有文件
|
||
* `Cmd+O`/`Ctrl+O` 打开一个新文件
|
||
* `n`: 跳转到下一个文件/如果下一个文件存在
|
||
* `p`: 跳转到上一个文件/如果上一个文件存在
|
||
* `t`: 打开一个新文件/如果新文件存在
|
||
* `Cmd+F`/`Ctrl+F`: 打开搜索。打开时,按下 `Enter` and `Shift+Enter` 查看结果
|
||
|
||
## 参与贡献
|
||
|
||
你想成为 speedscope 的贡献者吗? 查看 [CONTRIBUTING.md](./CONTRIBUTING.md) 关于设置开发环境的说明。
|